Dell Technologies (DELL) Stock Drops Despite Market Gains: Important Facts to Note
Zacks · Nov 4 4:45PM
DELLChips & AI hardware
−8.8% on the day
8 similar movesHigher 20 sessions later 88%
BOH pins the headline-sized moves of the 50 largest US stocks to their charts, records how the market reacted, and checks what happened after the most similar moments of the last two years. Every call is saved and graded later.
Pins mark the headline-sized moves (5%+ logged moves, 7%+ days) in this window. Data through the Nov 4 close.
Big one-day moves by the largest stocks, the headline behind each, and how often similar moves were higher 20 sessions later.
Since the Iran war began on Feb 27, Brent crude has been the market's war barometer: oil spikes have meant stock selloffs, and oil drops have meant rallies.
As of the Wednesday Nov 4 close.
"Own up 20" is how often charts like today's were higher 20 sessions later in the stock's own history; "Pool" uses all 50 stocks; "Baseline" is how often any 20-session stretch was up. Click a column to sort.
| Symbol | Name | Price | Today | From high | vs 200d | RSI | 1 mo | Own up 20 | n | Pool up 20 | Baseline | Setup |
|---|---|---|---|---|---|---|---|---|---|---|---|---|
| SPY | SPY | $766.81 | +1.7% | −1.6% | +5.5% | 51 | −1.6% | 80.0% | 10 | – | 66.8% | Leans rally |
| QQQ | QQQ | $691.95 | +1.0% | −8.9% | +1.8% | 39 | −8.9% | 60.0% | 5 | – | 63.3% | No clear edge |
| INTC | Intel | $58.27 | −3.8% | −58.7% | −33.1% | 23 | −48.2% | – | 0 | 66.7% | 57.9% | No clear edge |
| ORCL | Oracle Corporation | $123.73 | −1.9% | −49.9% | −20.2% | 43 | −14.2% | 33.3% | 3 | 53.3% | 45.4% | No clear edge |
| AMAT | Applied Materials | $369.40 | −3.3% | −48.9% | −16.9% | 34 | −30.3% | – | 0 | 56.2% | 62.7% | No clear edge |
| LRCX | Lam Research | $221.43 | −4.0% | −48.8% | −22.0% | 30 | −33.7% | 100.0% | 1 | 72.7% | 67.6% | No clear edge |
| CAT | Caterpillar Inc. | $591.30 | −5.2% | −44.2% | −26.7% | 23 | −31.4% | – | 0 | 81.8% | 61.4% | Leans rally |
| NFLX | Netflix, Inc. | $66.39 | +4.7% | −42.6% | −18.3% | 47 | −3.3% | 0.0% | 3 | 46.2% | 42.3% | Leans drop |
| DELL | Dell Technologies | $372.36 | −8.8% | −36.6% | +11.3% | 31 | −35.0% | – | 0 | 50.0% | 58.7% | No clear edge |
| MU | Micron Technology | $795.23 | −7.0% | −34.5% | +5.5% | 35 | −23.9% | – | 0 | 50.0% | 65.6% | Leans drop |
| AVGO | Broadcom | $325.48 | −2.0% | −32.2% | −11.2% | 42 | −13.4% | 66.7% | 3 | 64.1% | 55.6% | No clear edge |
| GOOGL | Alphabet Inc. (Class A) | $288.93 | +3.2% | −28.1% | −14.9% | 30 | −16.9% | 100.0% | 1 | 74.2% | 58.9% | Leans rally |
| AMD | Advanced Micro Devices | $488.78 | +1.0% | −24.7% | +18.0% | 39 | −24.7% | 50.0% | 2 | 46.7% | 53.5% | No clear edge |
| ASML | ASML Holding | $1,496.30 | −3.6% | −24.6% | −6.2% | 35 | −18.3% | 100.0% | 1 | 62.5% | 67.2% | No clear edge |
| IBM | IBM | $254.32 | +1.7% | −22.2% | +3.2% | 63 | +14.9% | – | 0 | 65.2% | 50.4% | Leans rally |
| TSLA | Tesla, Inc. | $385.19 | −3.3% | −21.4% | +0.1% | 51 | +1.2% | 33.3% | 3 | 60.0% | 51.5% | No clear edge |
| CSCO | Cisco | $103.61 | +0.6% | −20.0% | +2.3% | 40 | −12.2% | 100.0% | 1 | 61.9% | 63.3% | No clear edge |
| BAC | Bank of America | $51.63 | +4.0% | −19.9% | −5.3% | 45 | −4.5% | 100.0% | 2 | 57.3% | 54.8% | No clear edge |
| GS | Goldman Sachs | $928.00 | +3.6% | −19.1% | −2.4% | 55 | +3.4% | 100.0% | 1 | 62.3% | 60.0% | No clear edge |
| META | Meta Platforms | $630.00 | +1.4% | −19.0% | −0.2% | 40 | −14.7% | 40.0% | 5 | 54.6% | 51.5% | No clear edge |
| PLTR | Palantir Technologies | $171.70 | −2.1% | −17.9% | +11.8% | 33 | −10.6% | 33.3% | 3 | 56.5% | 62.7% | Leans drop |
| PANW | Palo Alto Networks | $348.04 | −0.6% | −17.1% | +27.8% | 41 | −17.1% | – | 0 | 73.9% | 56.2% | Leans rally |
| NVDA | Nvidia | $200.13 | −3.2% | −16.3% | −2.1% | 35 | −16.3% | 71.4% | 7 | 56.8% | 57.3% | No clear edge |
| MS | Morgan Stanley | $193.97 | +4.2% | −14.1% | +0.9% | 58 | +2.2% | 100.0% | 2 | 63.6% | 60.4% | No clear edge |
| CRWD | CrowdStrike | $241.00 | −1.5% | −13.6% | +42.4% | 45 | −13.6% | 100.0% | 2 | 73.3% | 60.8% | Leans rally |
| GE | GE Aerospace | $329.45 | +2.7% | −13.4% | +2.3% | 62 | +6.5% | 75.0% | 4 | 64.1% | 57.9% | Leans rally |
| RTX | RTX Corporation | $198.43 | −2.6% | −12.0% | +2.0% | 56 | +8.3% | 100.0% | 3 | 56.7% | 66.8% | Leans rally |
| XOM | ExxonMobil | $169.27 | −4.6% | −9.6% | +9.8% | 43 | +2.9% | 87.5% | 8 | 56.1% | 63.5% | No clear edge |
| CVX | Chevron Corporation | $216.96 | −3.7% | −7.9% | +12.9% | 45 | +4.5% | 66.7% | 3 | 60.7% | 64.9% | No clear edge |
| WFC | Wells Fargo | $87.43 | +2.2% | −7.8% | +5.3% | 63 | +7.3% | 66.7% | 6 | 64.9% | 56.2% | No clear edge |
| HD | Home Depot (The) | $355.44 | +6.5% | −7.1% | +7.6% | 74 | +24.0% | 100.0% | 2 | 73.7% | 47.3% | Leans rally |
| AMZN | Amazon | $266.03 | +6.1% | −6.3% | +9.2% | 60 | +3.8% | 55.6% | 9 | 58.6% | 56.0% | No clear edge |
| UNH | UnitedHealth Group | $409.38 | +1.2% | −5.6% | +13.5% | 57 | +8.8% | 50.0% | 2 | 60.7% | 52.5% | No clear edge |
| TXN | Texas Instruments | $311.49 | −0.3% | −5.3% | +20.3% | 66 | +5.3% | 40.0% | 5 | 58.5% | 48.8% | No clear edge |
| COST | Costco | $1,046.47 | +2.7% | −4.1% | +8.0% | 69 | +12.0% | 57.1% | 7 | 63.3% | 46.7% | Leans rally |
| LIN | Linde plc | $524.74 | +2.6% | −3.7% | +6.7% | 70 | +7.1% | 60.0% | 5 | 66.4% | 57.7% | No clear edge |
| WMT | Walmart | $129.17 | +3.5% | −3.5% | +9.2% | 74 | +20.5% | 33.3% | 3 | 65.6% | 57.5% | No clear edge |
| MRK | Merck & Co. | $150.36 | +3.9% | −3.3% | +19.2% | 57 | +5.9% | 60.0% | 5 | 53.1% | 62.0% | No clear edge |
| JPM | JPMorgan Chase | $352.11 | +4.2% | −3.1% | +9.7% | 64 | +6.3% | 66.7% | 9 | 58.6% | 58.7% | No clear edge |
| JNJ | Johnson & Johnson | $276.32 | +3.8% | −0.8% | +12.2% | 61 | +8.5% | 80.0% | 5 | 59.5% | 66.2% | No clear edge |
| TMO | Thermo Fisher Scientific | $706.16 | +1.1% | −0.4% | +28.0% | 60 | +7.6% | 33.3% | 3 | 52.5% | 58.1% | Leans drop |
| KO | Coca-Cola Company (The) | $95.80 | +1.1% | −0.0% | +17.2% | 65 | +11.2% | 33.3% | 3 | 61.6% | 60.8% | Leans drop |
| ABBV | AbbVie | $294.83 | +3.1% | −0.0% | +25.2% | 66 | +11.2% | 0.0% | 1 | 55.1% | 67.4% | Leans drop |
| AAPL | Apple Inc. | $349.51 | +5.3% | +0.0% | +17.5% | 58 | +4.8% | 71.4% | 7 | 58.4% | 63.3% | No clear edge |
| MSFT | Microsoft | $555.80 | +6.7% | +0.0% | +26.9% | 64 | +5.0% | 0.0% | 2 | 54.2% | 51.9% | No clear edge |
| LLY | Lilly (Eli) | $1,417.99 | +0.6% | +0.0% | +29.5% | 77 | +22.5% | 50.0% | 2 | 62.9% | 57.3% | No clear edge |
| BRK-B | Berkshire Hathaway | $579.09 | +4.0% | +0.0% | +16.6% | 83 | +14.5% | – | 0 | 65.5% | 51.7% | Leans rally |
| V | Visa Inc. | $436.57 | +3.8% | +0.0% | +27.3% | 76 | +17.8% | 0.0% | 1 | 57.9% | 55.4% | No clear edge |
| MA | Mastercard | $672.68 | +3.9% | +0.0% | +25.5% | 75 | +18.9% | – | 0 | 55.6% | 50.4% | No clear edge |
| PG | Procter & Gamble | $167.32 | +3.2% | +0.0% | +13.7% | 70 | +13.5% | 0.0% | 2 | 62.0% | 44.6% | Leans rally |
| PM | Philip Morris International | $211.28 | +1.6% | +0.0% | +16.5% | 67 | +11.0% | 20.0% | 5 | 59.6% | 59.8% | Leans drop |
| AMGN | Amgen | $478.48 | +3.7% | +0.0% | +27.9% | 73 | +18.8% | 50.0% | 2 | 61.6% | 57.1% | No clear edge |
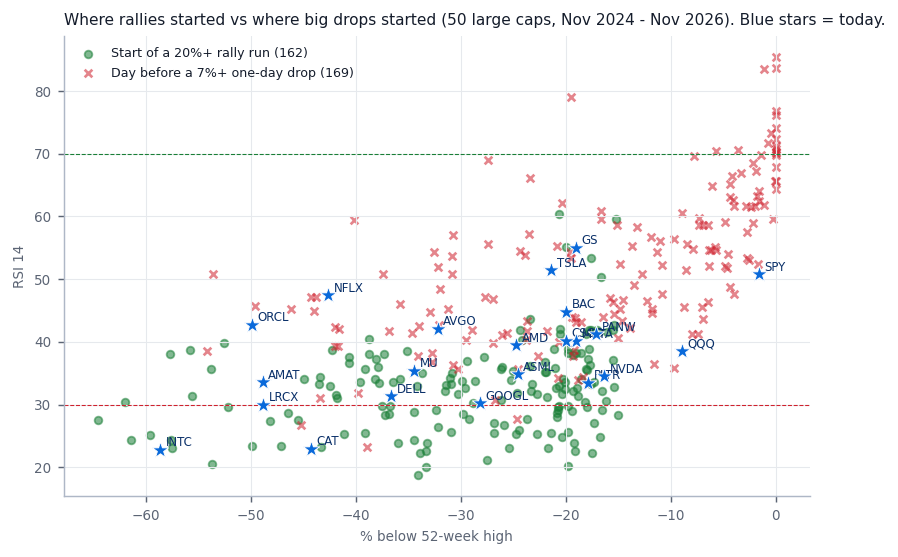
When one of the 50 largest US stocks moves 5% or more in a day, the move is saved with the market's reaction and the headlines found that evening.
Each move and each chart is compared with the closest past moments of the last two years: same direction, similar size and setup, similar market backdrop.
Every call is saved when it's made, then scored against what prices did 1, 5 and 20 sessions later. The track record keeps the misses.