Wed Nov 4, 2026 Brent −8.7%
Brent −8.7% · SPY +1.6% · QQQ +1.0% · Bitcoin +4.0% · Duke +2.4% · Utilities +0.4% · Energy −4.7% · Gold +3.7% · RTX −2.6% · Lockheed −6.9% · VIX (pts) -4.2
No Iran headlines were found in the window when this was logged.
How Iran-US-Israel headlines moved markets, from the June 2025 strikes through the 2026 war. Brent crude is the thread: it spikes on escalation and drops on ceasefire or deal news, and since the war began stocks have moved against it.
174 trading sessions since the war began on Feb 27, 2026. Prices through the Nov 4 close.
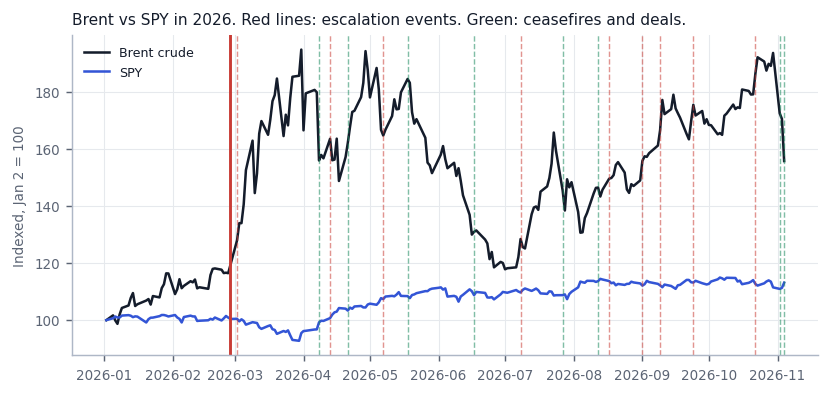
Average move on days Brent rose or fell 4% or more since the war began (26 up, 20 down). VIX in points.
| Brent up 4%+ | Brent down 4%+ | |
|---|---|---|
| Brent | +5.9% | −7.6% |
| SPY | −0.4% | +0.7% |
| QQQ | −0.5% | +0.8% |
| Bitcoin | −0.7% | +0.6% |
| Duke | −0.1% | −0.0% |
| Utilities | −0.3% | +0.1% |
| Energy | +1.2% | −2.1% |
| Gold | −0.6% | +0.7% |
| RTX | +0.0% | +0.4% |
| Lockheed | +0.4% | −0.7% |
| VIX (pts) | +1.05 | −0.70 |
| Before the war | During the war | |
|---|---|---|
| SPY | 21 | -45 |
| QQQ | 20 | -34 |
| Bitcoin | 9 | -20 |
| Duke | -8 | 0 |
| Utilities | 10 | -14 |
| Energy | 63 | 65 |
| Gold | 19 | -28 |
| RTX | 21 | -11 |
| Lockheed | 10 | 13 |
| VIX (pts) | -24 | 38 |
Reaction over the event day and the next session, since several announcements came after the close. Escalations sent oil up 83% of the time and SPY down 58%; de-escalations sent oil down 67% and SPY up 67%.
| Date | Kind | Event | Brent | SPY | QQQ | Bitcoin | Duke | Energy | RTX | VIX | SPY next 5 | SPY next 20 |
|---|---|---|---|---|---|---|---|---|---|---|---|---|
| Nov 4 26 | De-escalation | Oil -9% as traders price an end to the war (midterm day) | −8.7% | +1.7% | +1.0% | +4.0% | +2.4% | −4.7% | −2.6% | −4.22 | – | – |
| Nov 2 26 | De-escalation | Trump says Iran wants a deal; oil -7% | −11.9% | −0.2% | −0.8% | +0.2% | −0.7% | −4.8% | +2.0% | +1.41 | – | – |
| Oct 22 26 | Escalation | Iran claims seven tankers hit; Brent highest since May | +7.3% | −1.7% | −2.9% | −3.5% | +3.6% | +1.7% | −0.3% | +2.77 | −0.6% | – |
| Sep 24 26 | Escalation | Iran sets an Indian Ocean deadline; Brent +4.4% | +1.2% | +0.5% | +0.4% | −0.4% | −0.7% | −0.5% | −1.5% | −0.31 | −0.2% | −1.5% |
| Sep 9 26 | Escalation | Brent back above $100 | +9.9% | −1.1% | −1.3% | −2.4% | −1.5% | +0.2% | −0.3% | +2.12 | +0.6% | +2.4% |
| Sep 1 26 | Escalation | About 100 US strikes approved; Iran hits US bases | +5.7% | −0.2% | −1.0% | −1.6% | +0.5% | +1.8% | −3.3% | +0.28 | −1.0% | +0.1% |
| Aug 17 26 | Escalation | 60-day memorandum lapses without renewal | +2.8% | −1.1% | −1.9% | +2.7% | +0.1% | +2.9% | +1.1% | +1.59 | −0.2% | −1.7% |
| Aug 12 26 | De-escalation | Second memorandum signed at Versailles | −2.1% | +0.9% | +1.9% | −0.2% | +1.1% | +0.2% | −1.5% | −0.65 | −2.0% | −1.7% |
| Jul 27 26 | De-escalation | Hostilities pause; Brent -11% | −13.1% | +0.3% | −1.3% | −0.4% | −1.0% | −3.4% | +2.7% | −0.37 | +4.1% | +3.4% |
| Jul 8 26 | Escalation | Ceasefire collapses after Iranian attacks on ships; US strikes | +2.9% | +0.5% | +2.0% | −0.2% | −2.3% | +0.3% | −2.8% | −0.29 | −0.1% | +2.2% |
| Jun 17 26 | De-escalation | Islamabad Memorandum signed; blockades lifted | +1.1% | −0.2% | +1.5% | −4.1% | −1.7% | −2.9% | −0.6% | −0.01 | −2.4% | −0.6% |
| May 18 26 | De-escalation | Trump calls off a strike wave to allow talks | +1.8% | −0.7% | −1.0% | −2.9% | +3.0% | +3.1% | +1.9% | −0.37 | +2.3% | +1.0% |
| May 7 26 | Escalation | US strikes on Iran | +0.0% | +0.5% | +2.2% | −1.5% | −1.1% | −2.3% | −0.4% | −0.20 | +0.2% | +0.2% |
| Apr 21 26 | De-escalation | US announces an indefinite ceasefire | +6.7% | +0.4% | +1.3% | +3.1% | −2.0% | +2.7% | −7.6% | +0.05 | +0.1% | +4.2% |
| Apr 13 26 | Escalation | Islamabad talks fail | −0.4% | +2.2% | +2.9% | +1.6% | −1.5% | −1.7% | +0.6% | −0.87 | +1.4% | +6.3% |
| Apr 8 26 | De-escalation | Two-week ceasefire, mediated by Pakistan | −12.2% | +3.1% | +3.7% | −0.2% | +0.9% | −4.7% | +2.7% | −6.29 | +3.2% | +7.6% |
| Mar 2 26 | Escalation | First full week of war; Iran closes the Strait of Hormuz | +12.3% | −0.8% | −0.9% | +3.7% | +0.4% | +1.1% | +1.9% | +3.71 | −0.5% | −4.1% |
| Feb 27 26 | Escalation | US and Israel begin strikes on Iran; the war starts | +9.9% | −0.4% | −0.2% | +2.0% | +1.9% | +3.6% | +7.4% | +2.81 | −1.2% | −7.7% |
| Jun 24 25 | De-escalation | Israel-Iran ceasefire | −5.3% | +1.2% | +1.8% | +1.7% | −0.9% | −1.7% | −3.0% | −3.07 | +2.2% | +4.5% |
| Jun 23 25 | Escalation | First session after US strikes on Fordow and Natanz (Jun 22); Iran's response was limited | −12.8% | +2.1% | +2.6% | +2.6% | +1.3% | −3.8% | −3.3% | −3.14 | +1.8% | +4.5% |
| Jun 13 25 | Escalation | Israel strikes Iran's nuclear sites | +5.6% | −0.2% | +0.1% | +0.8% | −1.6% | +1.4% | +3.9% | +1.09 | +1.0% | +3.9% |
Each cluster of 4%+ Brent drops, counted once. Back = sessions until Brent regained the close before the drop.
| Drop began | Brent that day | Back to pre-drop | Brent 20 sessions later | SPY 20 sessions later |
|---|---|---|---|---|
| Mar 10 26 | −11.3% | 2 sessions | +7.9% | +0.1% |
| Mar 23 26 | −10.9% | 4 sessions | −1.5% | +7.4% |
| Apr 1 26 | −14.5% | no | +12.7% | +9.7% |
| May 1 26 | −5.1% | 1 sessions | −12.2% | +5.3% |
| May 20 26 | −5.6% | no | −24.0% | +1.0% |
| Jun 15 26 | −4.8% | no | +2.1% | +0.3% |
| Jul 27 26 | −8.7% | no | +4.3% | +3.3% |
| Nov 2 26 | −10.9% | not yet | – | – |
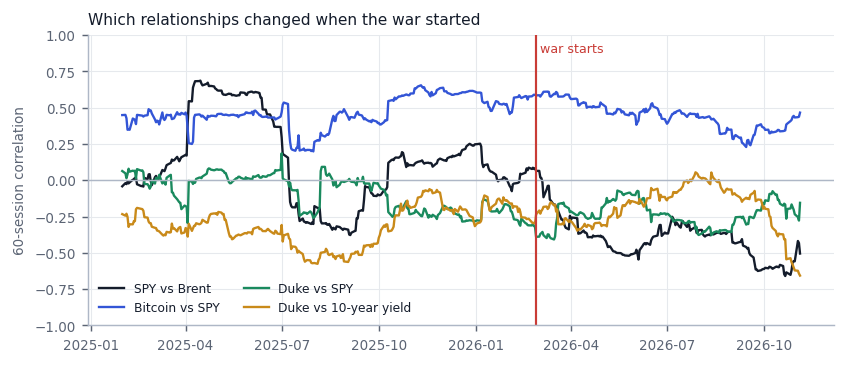
Correlation of daily moves with SPY (×100). Oil-shock days are Brent ±4%; calm days are the rest of the war.
| Before war | During war | Oil-shock days | Calm days | Last 60 | Last 20 | |
|---|---|---|---|---|---|---|
| Bitcoin vs SPY | 41 | 43 | 57 | 40 | 47 | 68 |
| Duke vs SPY | -5 | -22 | -24 | -22 | -16 | -40 |
| Utilities vs SPY | 44 | 5 | 6 | 5 | 6 | -27 |
| Duke vs | Last 20 sessions | Last 60 sessions |
|---|---|---|
| SPY | -40 | -16 |
| Chips (SOXX) | -74 | -49 |
| 10-year yield | -73 | -66 |
| Vistra (AI power) | -65 | -29 |
| Brent | 4 | -15 |
Each update saves any day Brent moves 4%+ with the Iran headlines found, so the record builds up and can be checked later.
Brent −8.7% · SPY +1.6% · QQQ +1.0% · Bitcoin +4.0% · Duke +2.4% · Utilities +0.4% · Energy −4.7% · Gold +3.7% · RTX −2.6% · Lockheed −6.9% · VIX (pts) -4.2
No Iran headlines were found in the window when this was logged.