BOH
Brent94.62−8.67%SPY766.81+1.65%QQQ691.95+0.97%DELL372.36−8.82%MU795.23−7.00%MSFT555.80+6.68%HD355.44+6.53%AMZN266.03+6.12%AAPL349.51+5.31%CAT591.30−5.23%NFLX66.39+4.68%XOM169.27−4.62%MS193.97+4.23%JPM352.11+4.18%LRCX221.43−4.03%BAC51.63+3.97%BRK-B579.09+3.95%MA672.68+3.94%MRK150.36+3.93%

Wars and oil shocks in history

The 2026 Iran war lined up against past wars and oil shocks, each starting from the close before it began: the 1973 embargo, the 1979 Iranian Revolution, the Iran-Iraq War, the Gulf War, the Iraq invasion, Russia's invasion of Ukraine and the 2025 twelve-day war. History rarely repeats, but it rhymes.

How today tracks

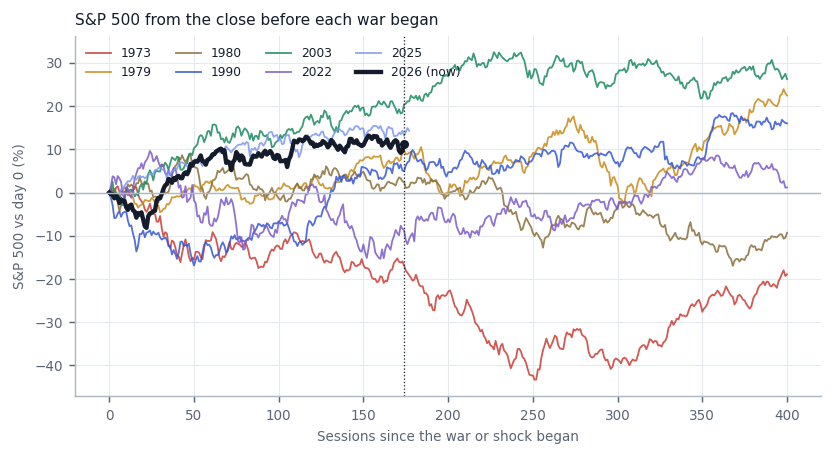
174 trading sessions since the war began. Prices through the Nov 4 close.

Stocks from the start of each war

S&P 500 paths after past wars

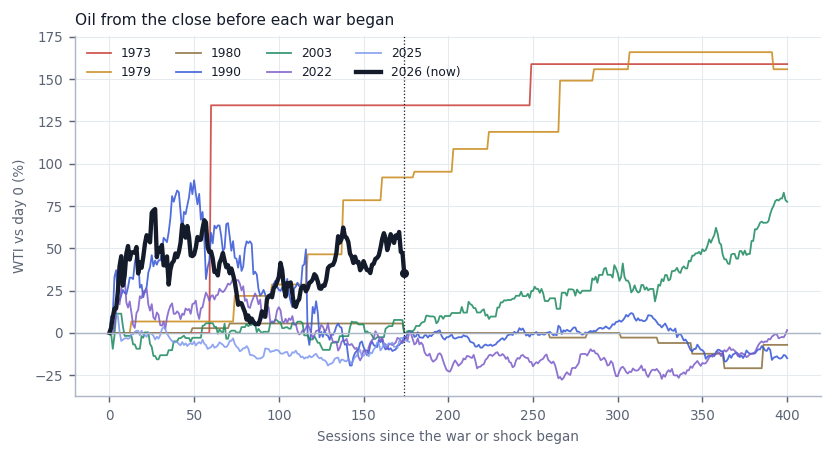
Oil from the start of each war

WTI crude. 1973-1980 use monthly prices, so those lines move in steps.

Oil paths after past wars

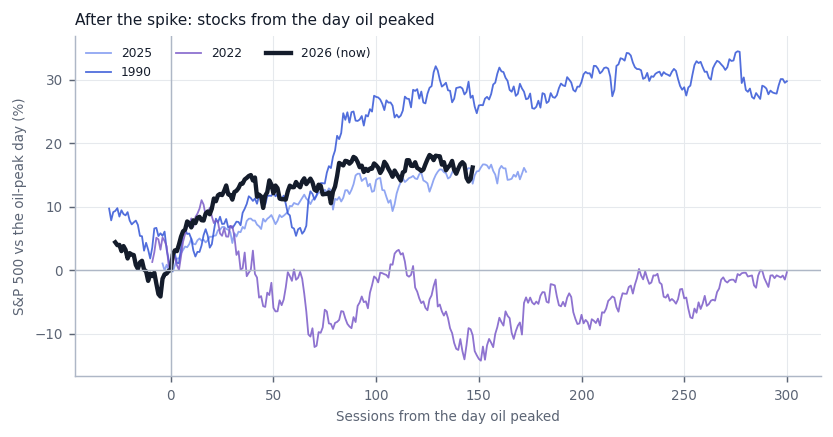
After the spike

Wars with daily oil data (1990, 2022, 2025), re-based to the day oil peaked; monthly prices can't date a peak. Today sits 147 sessions past its peak.

S&P 500 after the oil peak in past wars

Side by side

"At this point" means session 174, today's distance from the start. Ranked by how closely the S&P 500 and oil paths so far match today's. "Next" columns are what followed from that point.

EpisodeS&P at this pointOil at this pointS&P worstSessionOil peakSessionS&P next 20Next 60Next 120Next 250Oil next 60Oil next 120
–2026 Iran war (now) Unusual+11.3%+35.1%−8.2%22+73.2%27??????
11979 Iranian Revolution Unusual+9.7%+91.9%−4.5%30+118.9%224−8.0%−1.0%−4.4%+16.7%+14.0%+33.3%
22025 Israel-Iran 12-day war+13.1%−3.4%−1.3%5+10.4%4––––––
32003 Iraq invasion+20.4%−0.1%−3.0%8+24.8%249+4.2%+8.5%+3.7%+11.9%+19.2%+34.4%
41980 Iran-Iraq War+2.4%+0.0%−17.0%368+5.6%71−0.4%−5.5%−9.2%−14.6%+0.0%+0.0%
51990 Iraq invades Kuwait and the Gulf War+5.0%−2.4%−16.9%50+90.2%50+1.4%+0.2%+3.9%+7.6%−0.8%+5.6%
62022 Russia invades Ukraine Unusual−8.7%−4.1%−15.3%160+34.2%9+5.8%+4.2%+5.2%+8.8%−11.8%−15.9%
71973 Yom Kippur War and Arab oil embargo Unusual−16.9%+134.6%−43.3%251+158.9%249−8.2%−24.2%−26.2%−0.8%+0.0%+10.4%

Why these trended differently

  • 2026 Iran war (now) (oil at this point +35.1% vs a median of +0.0%)
    Oil is still well above pre-war while stocks are up. Unlike 1973, 1979 and 1990, the US now exports more petroleum than it imports (since 2020), so dearer oil hurts the US economy less; and a ceasefire came within six weeks, so the stock low came early. Source: EIA: US petroleum imports and exports
  • 1973 Yom Kippur War and Arab oil embargo (S&P 500 at this point −16.9% vs a median of +7.3%; oil at this point +134.6% vs a median of +0.0%; S&P 500 worst drop −43.3% vs a median of −11.8%)
    Stagflation did the damage. US inflation was already about 8% and heading for 12%, the Fed was tightening, the dollar's Bretton Woods link had just collapsed, Watergate was deepening, and richly valued 'Nifty Fifty' stocks were deflating. The embargo was the spark, not the whole fire; the market took years to get back to even. Source: RBC Wealth Management
  • 2022 Russia invades Ukraine (S&P 500 at this point −8.7% vs a median of +7.3%)
    The Fed's fastest rate hikes since the early 1980s, against 9% inflation, drove the decline; the war's oil spike faded within weeks. Source: RBC Wealth Management
  • 1979 Iranian Revolution (oil at this point +91.9% vs a median of +0.0%)
    Oil kept climbing because supply kept falling: Iranian output collapsed after the revolution, OPEC raised official prices again and again, and the Iran-Iraq War in 1980 cut supply a second time. Monthly, partly controlled US prices also move in steps. Source: Kiplinger

The episodes

1973 Yom Kippur War and Arab oil embargo

Day 0: close before Oct 6, 1973Oil: monthly data

Egypt and Syria attacked Israel on Oct 6, 1973. Arab oil producers cut output and embargoed the US on Oct 17, and posted oil prices roughly quadrupled by early 1974. Stocks were already falling on inflation, Fed tightening and Watergate, and kept falling until October 1974.

Rhymes and differences. Inflation was already high and the US slid into a deep recession. Oil was price-controlled, so the monthly series moves in steps.

  • Oct 17, 1973: Embargo begins (session 8)
  • Mar 18, 1974: Embargo lifted (session 112)
  • Oct 3, 1974: S&P 500 low (session 251)

1979 Iranian Revolution

Day 0: close before Jan 16, 1979Oil: monthly data

The Shah left Iran on Jan 16, 1979. Iranian output collapsed and oil roughly doubled over 1979-80. Stocks rose modestly while inflation reached double digits, until the Fed under Volcker tightened sharply from October 1979.

Rhymes and differences. An Iran supply shock like today, but it played out over two years against double-digit inflation.

  • Oct 6, 1979: Volcker's Fed shock (session 185)
  • Nov 4, 1979: US embassy hostages taken (session 205)

1980 Iran-Iraq War

Day 0: close before Sep 22, 1980Oil: monthly data

Iraq invaded Iran on Sep 22, 1980, knocking out much of both countries' oil exports. Oil rose briefly; stocks rallied into late November 1980, then fell in the 1981-82 recession as the Fed held rates near 20%.

Rhymes and differences. The war dragged on for eight years, but its market effect faded within months; the Fed drove what followed.

  • Nov 28, 1980: S&P 500 peak (session 48)
  • Jul 1, 1981: Fed funds near 19% (session 196)

1990 Iraq invades Kuwait and the Gulf War

Day 0: close before Aug 2, 1990

Iraq invaded Kuwait on Aug 2, 1990. Oil more than doubled by October and the S&P 500 fell to its Oct 11 low as the US slipped into recession. When the air war began on Jan 17, 1991, oil collapsed by a third in a day and stocks jumped.

Rhymes and differences. The closest military analog: a US-led Gulf war with an oil spike. But the US was entering a recession, and the war ended in six weeks of fighting.

  • Oct 11, 1990: S&P 500 low (session 50)
  • Jan 17, 1991: Air war begins; oil -33% in a day (session 117)
  • Feb 28, 1991: Ceasefire (session 146)

2003 Iraq invasion

Day 0: close before Mar 20, 2003

Stocks fell through the build-up and bottomed on Mar 11, 2003, nine days before the invasion; oil fell as it began. It's the classic 'sell the build-up, buy the invasion' case.

Rhymes and differences. Oil supply barely suffered and the economy was leaving a recession, so the war removed uncertainty instead of adding it.

  • Mar 11, 2003: S&P 500 low, before the invasion (session -6)
  • Apr 9, 2003: Baghdad falls (session 15)

2022 Russia invades Ukraine

Day 0: close before Feb 24, 2022

Russia invaded Ukraine on Feb 24, 2022. Brent peaked near $128 on Mar 8. The S&P 500 kept falling until Oct 12, 2022, but mostly because the Fed raised rates seven times that year.

Rhymes and differences. The oil spike faded within weeks; inflation and rate hikes, not the war, set the market's path.

  • Mar 8, 2022: Oil peaks (session 9)
  • Mar 16, 2022: First Fed hike (session 15)
  • Oct 12, 2022: S&P 500 low (session 160)

2025 Israel-Iran 12-day war

Day 0: close before Jun 13, 2025

Israel struck Iran on Jun 13, 2025; the US hit Iranian nuclear sites on Jun 22; a ceasefire came on Jun 24. Oil spiked and fully reversed within two weeks; stocks barely noticed.

Rhymes and differences. Short and contained: Hormuz stayed open.

  • Jun 22, 2025: US strikes Fordow and Natanz (session 6)
  • Jun 24, 2025: Ceasefire (session 7)

Read this carefully

Sources