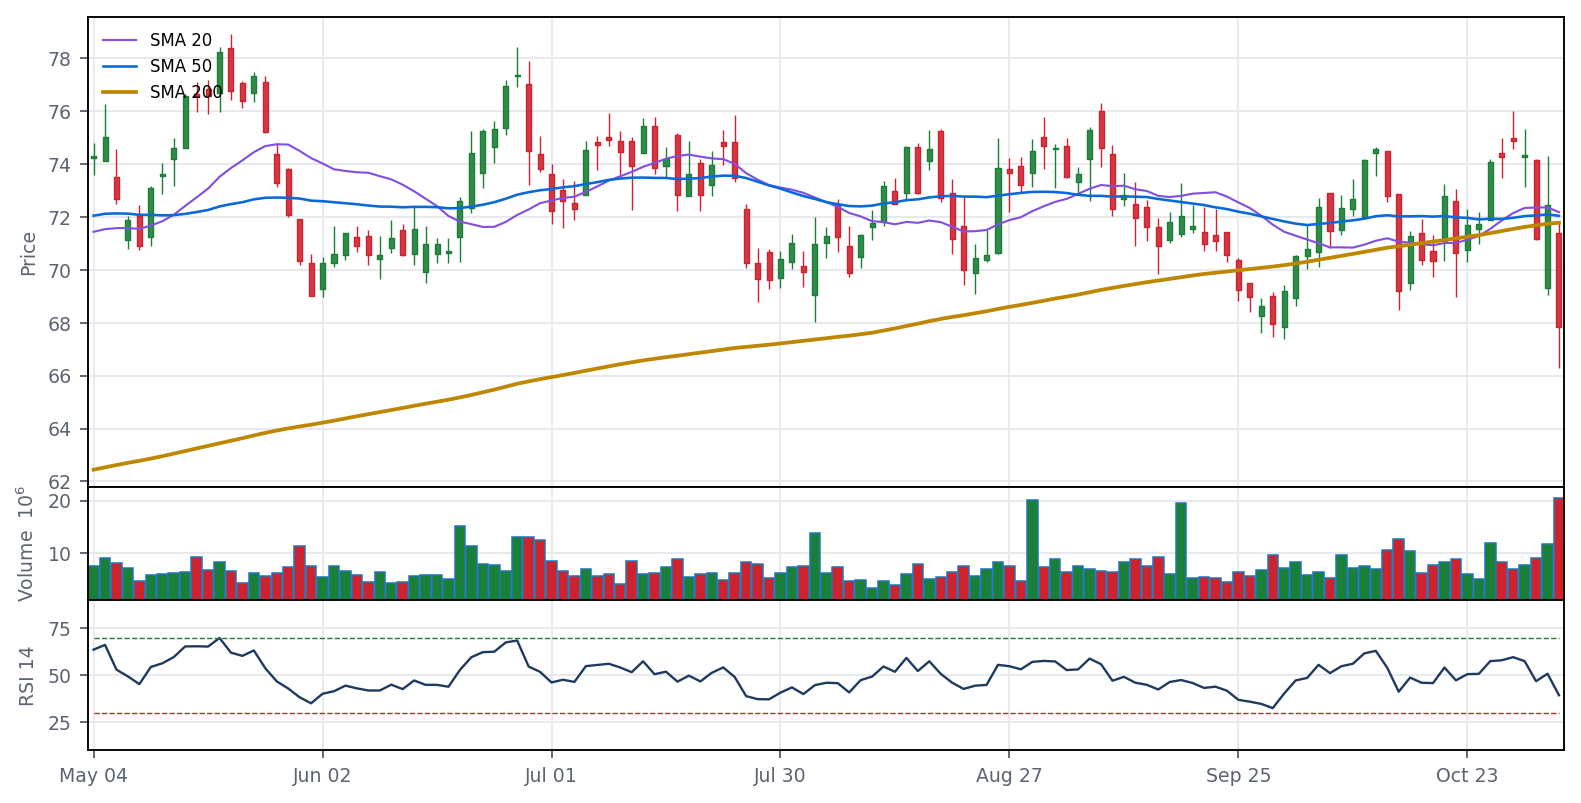
Stocks with growing positive earnings that closed below their 200-day average and look oversold. Screened at the
Wed Nov 4, 2026 close: 518 screened → 444 liquid → 143 below the 200-day → 43 oversold →
29 with growing earnings.
Watch for
Notes for Thu Nov 5.
Wednesday split the market. The Dow rose about 3% on the midterm result, but AI and data-center names sold off after Democrats won both chambers and a Texas governor-elect promised a data-center moratorium. Oil fell 7.7% on US-Iran peace hopes, hitting DVN, FANG, BKR, KMI and WMB.
After the bell Wednesday: COHR beat and raised guidance, up about 5% overnight. CF was mixed (EPS miss, revenue beat). ALNY announced a $1B buyback and its commercial chief is leaving; its HELIOS-B heart-drug data is at the AHA meeting Nov 9.
Thursday: DVN reports after the close (options held overnight carry the move and the IV crush). Lumentum reports, which matters for COHR and for MRVL's pending $115B all-stock deal to buy it.
NVDA (Nov 17), AMAT (Nov 12), KEYS (Nov 19) report within about two weeks. Implied volatility will be elevated.
Friday Nov 6, 8:30am ET: October jobs report. The Fed's next meeting is December.
QQQ is below its 50-day (RSI 38.6) while SPY, IWM and DIA hold above theirs. Most of this list is tech/semis.
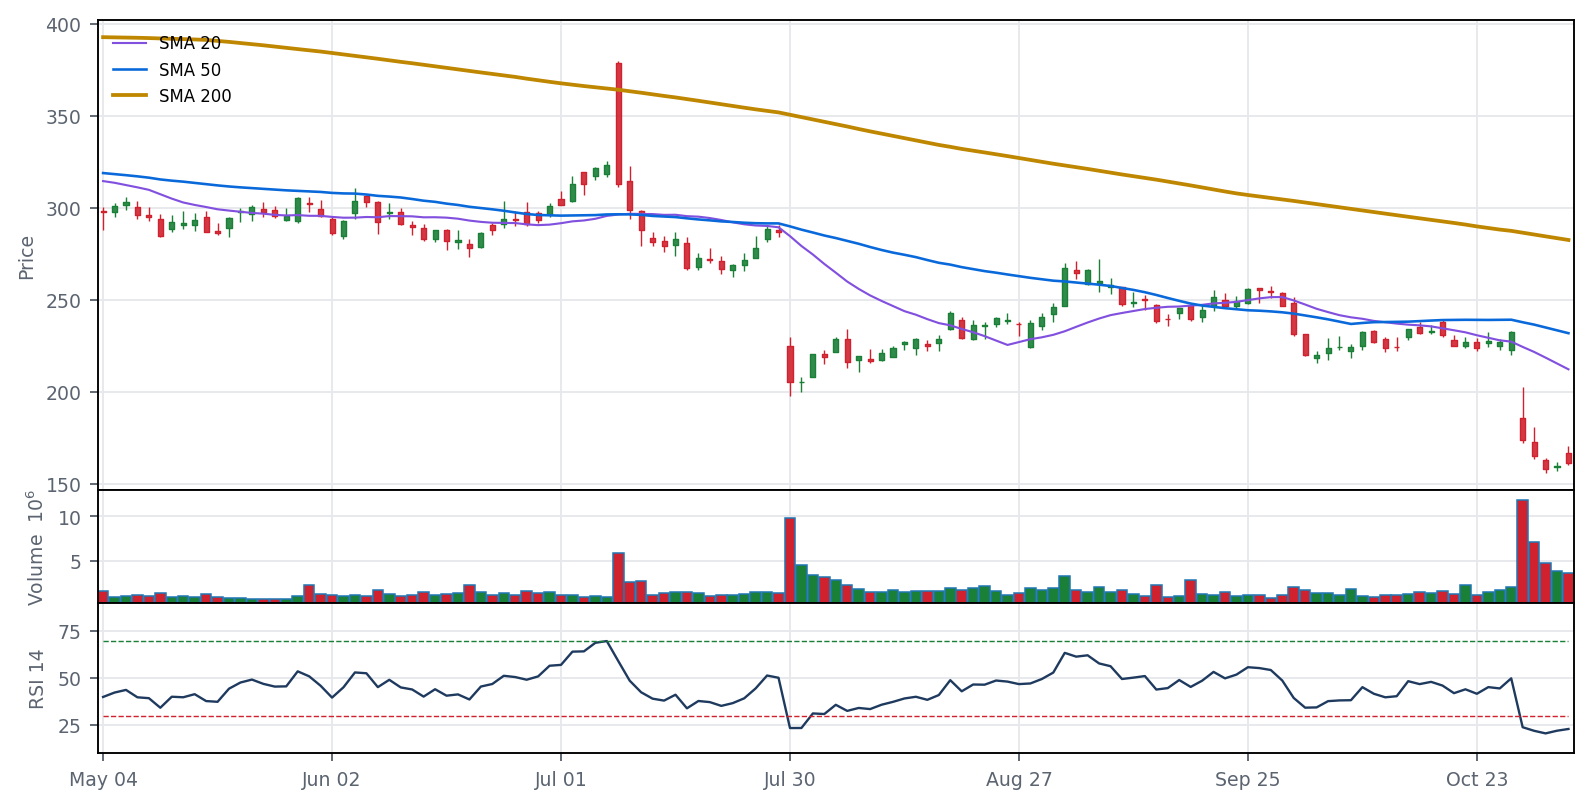
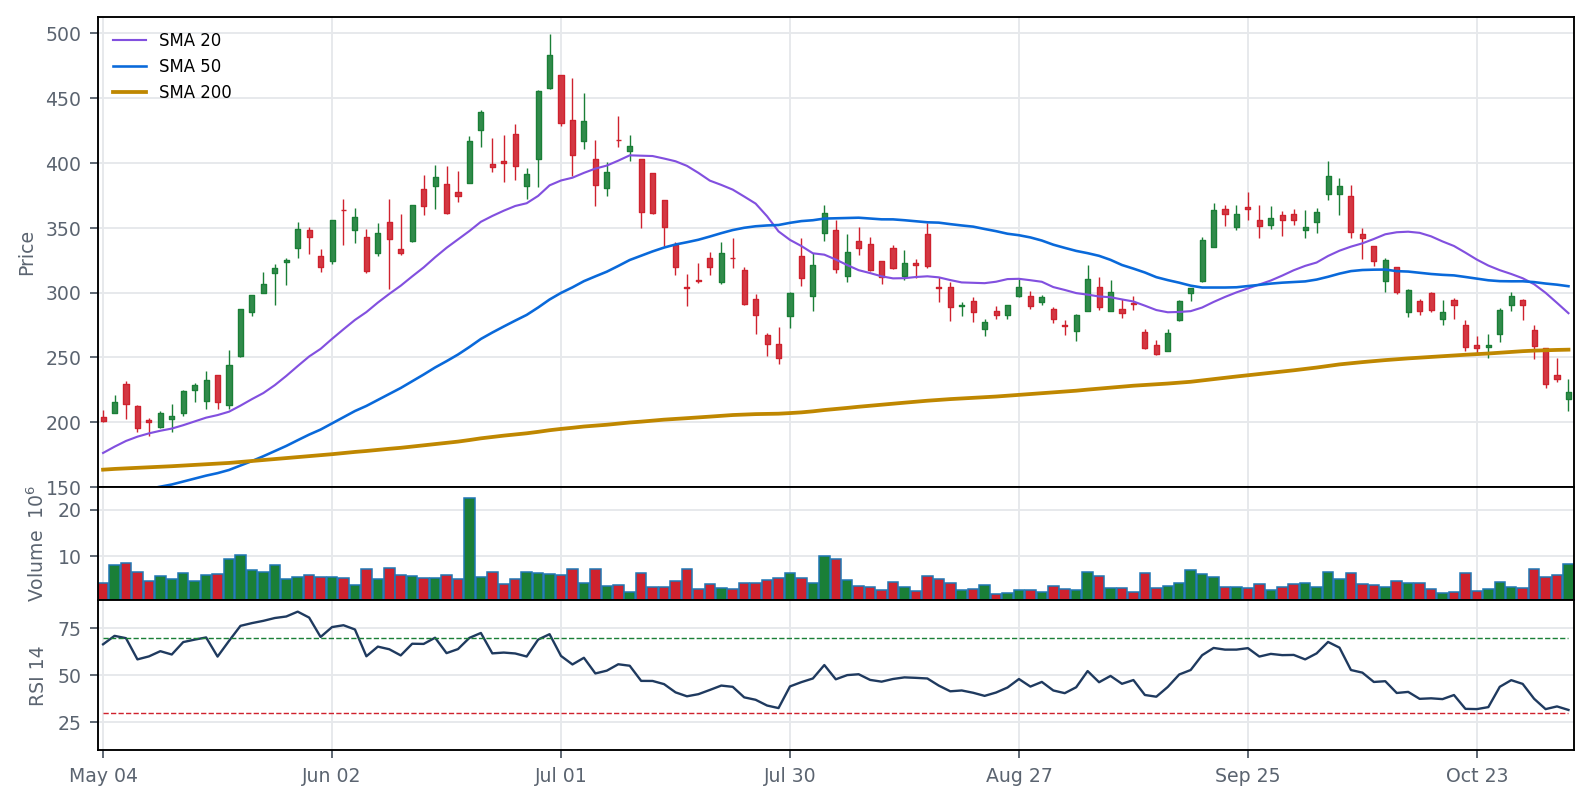
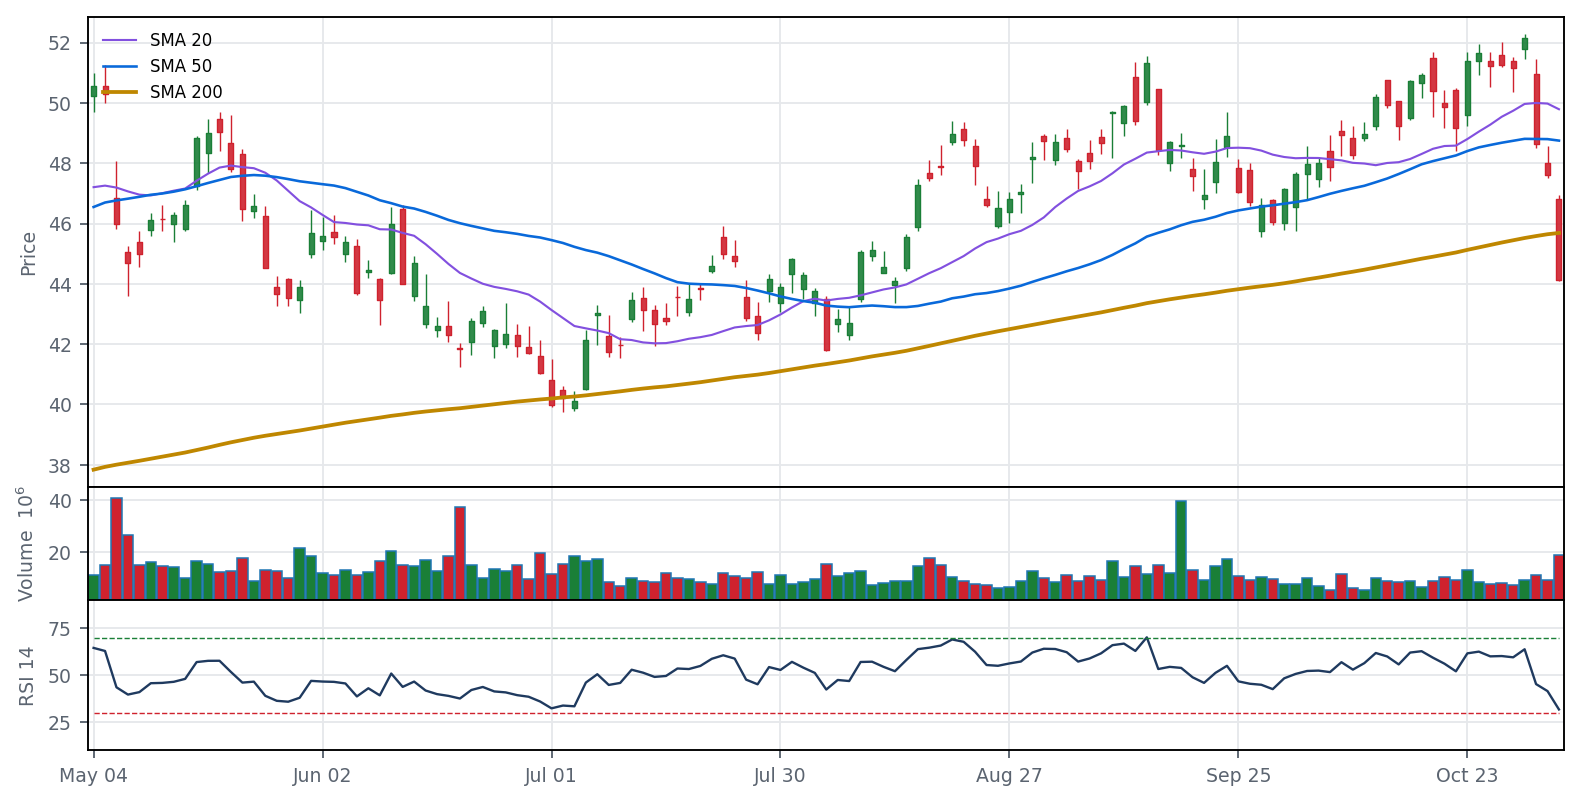
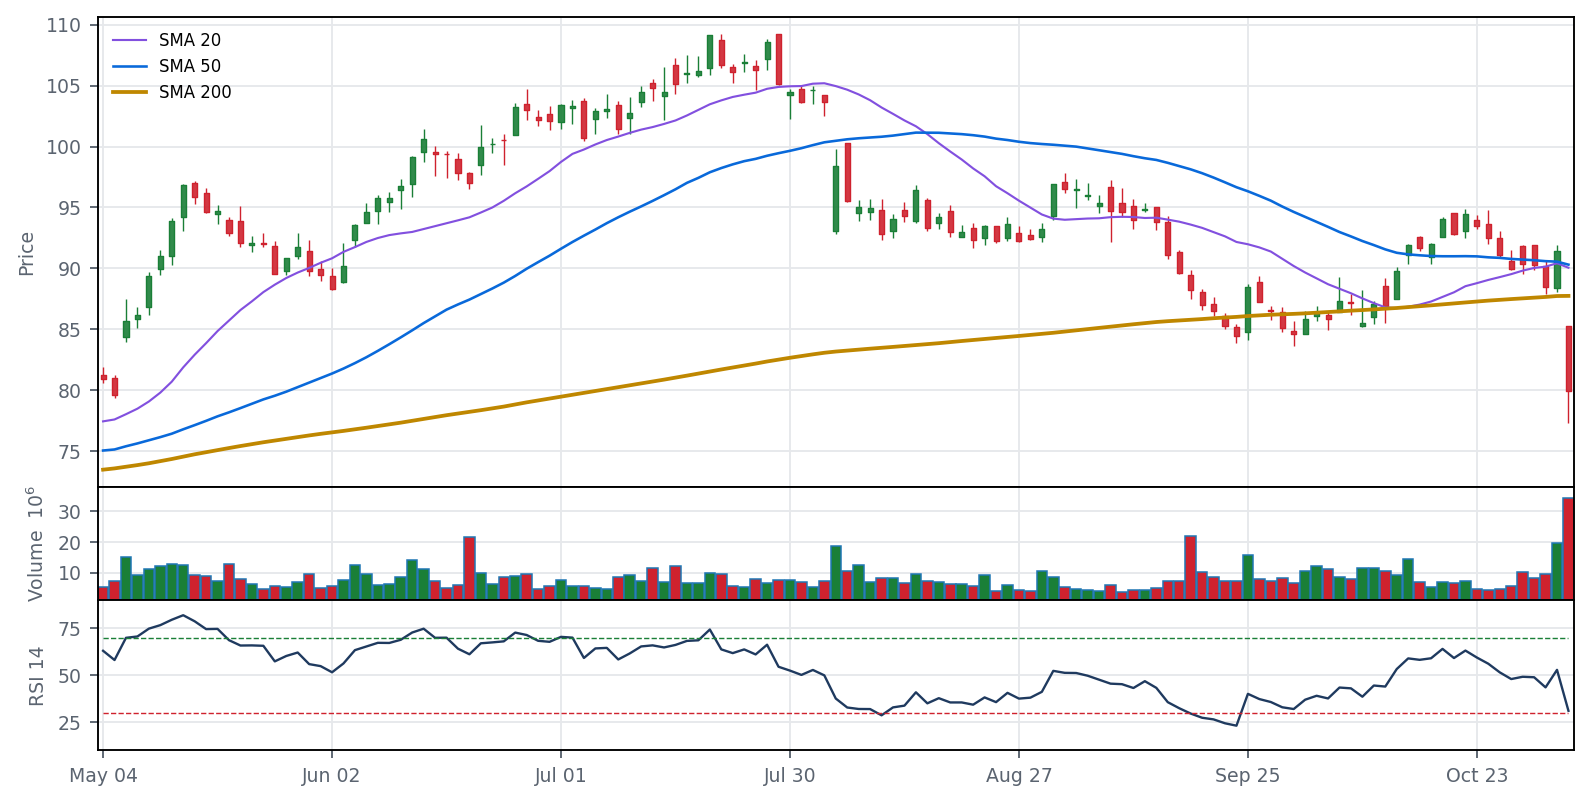
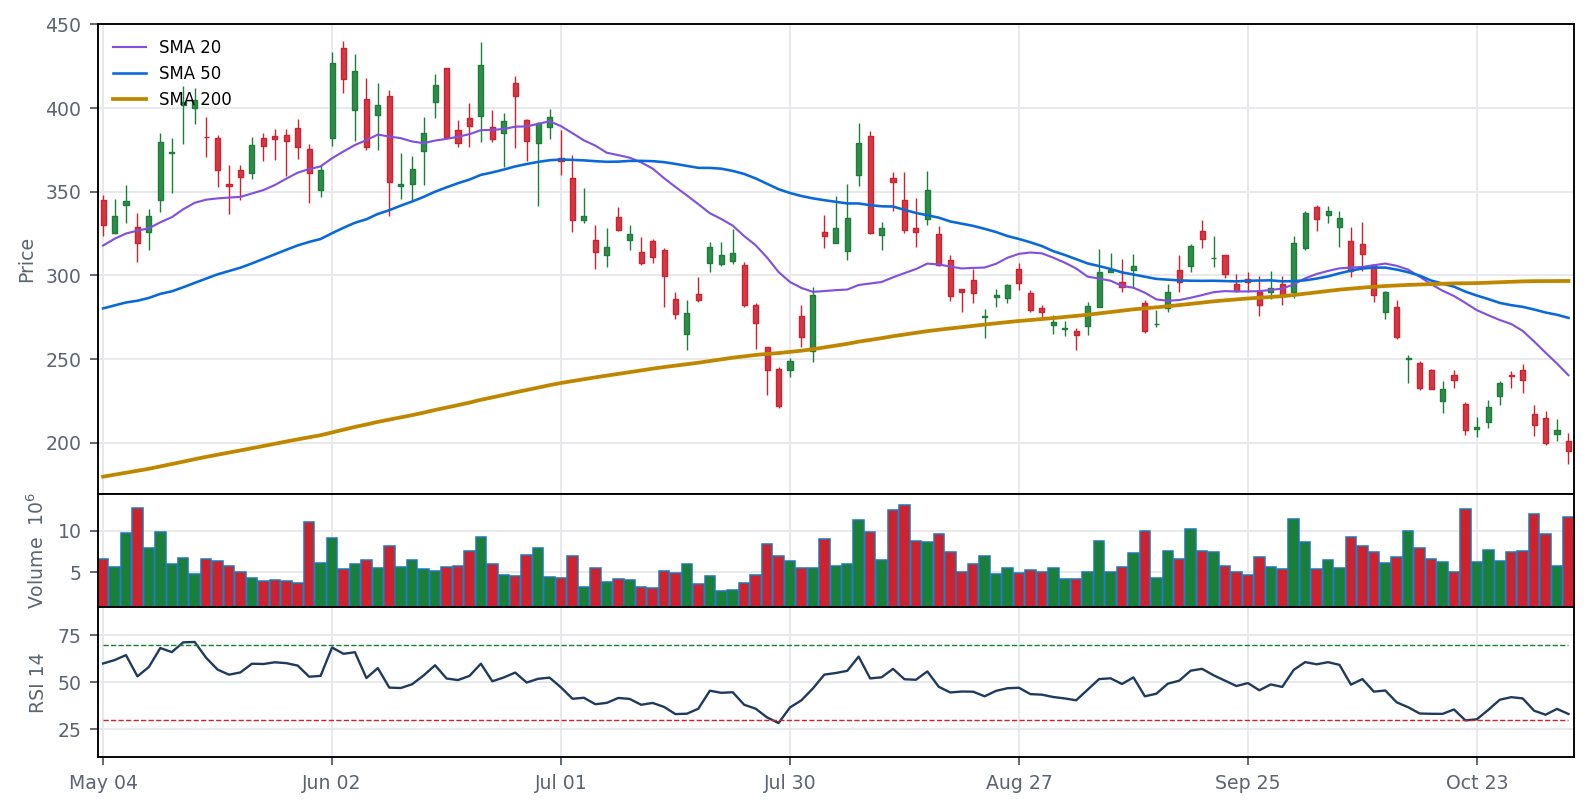
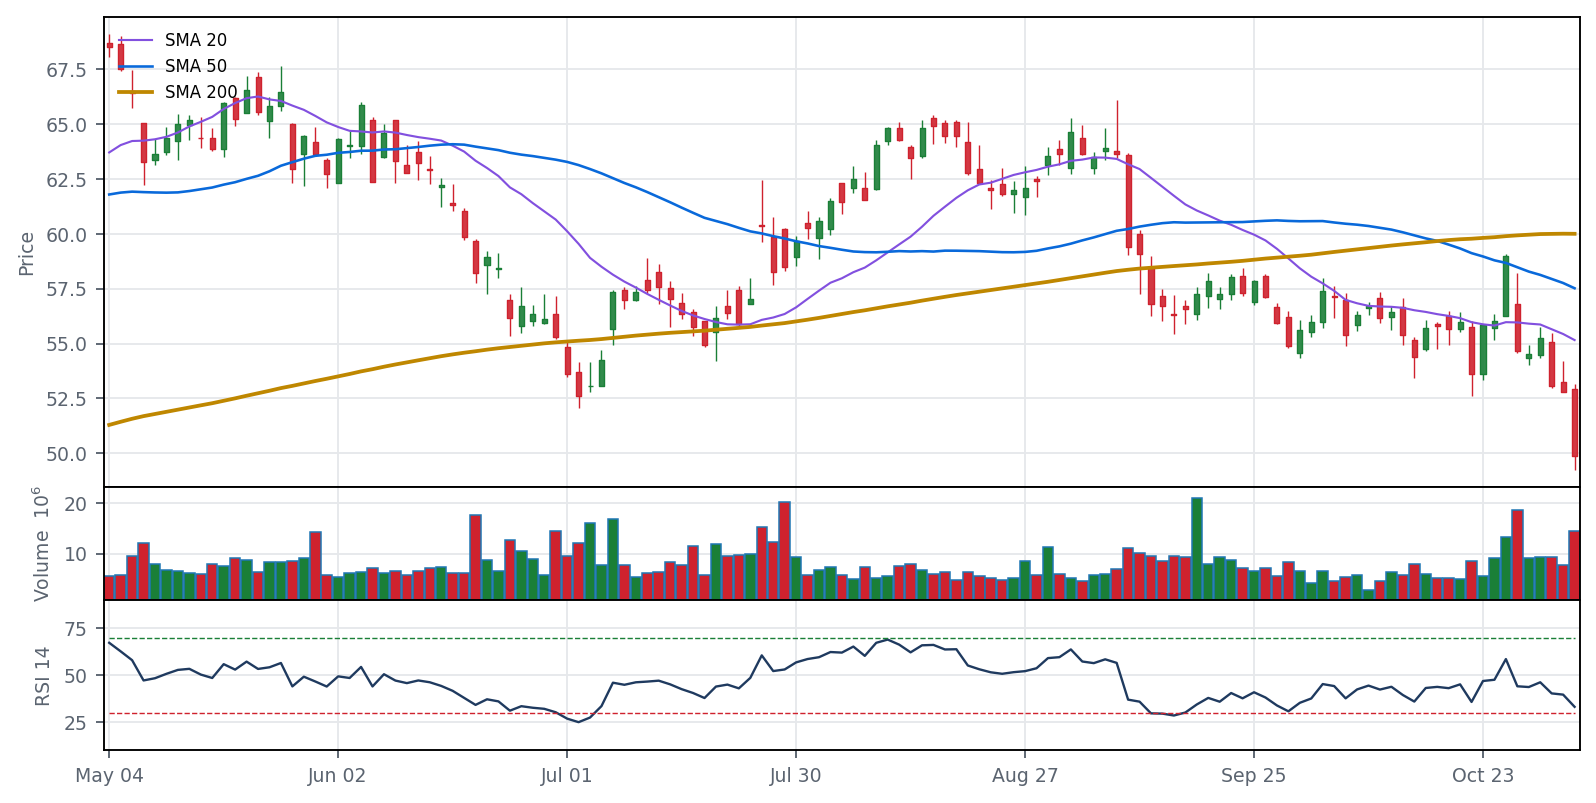
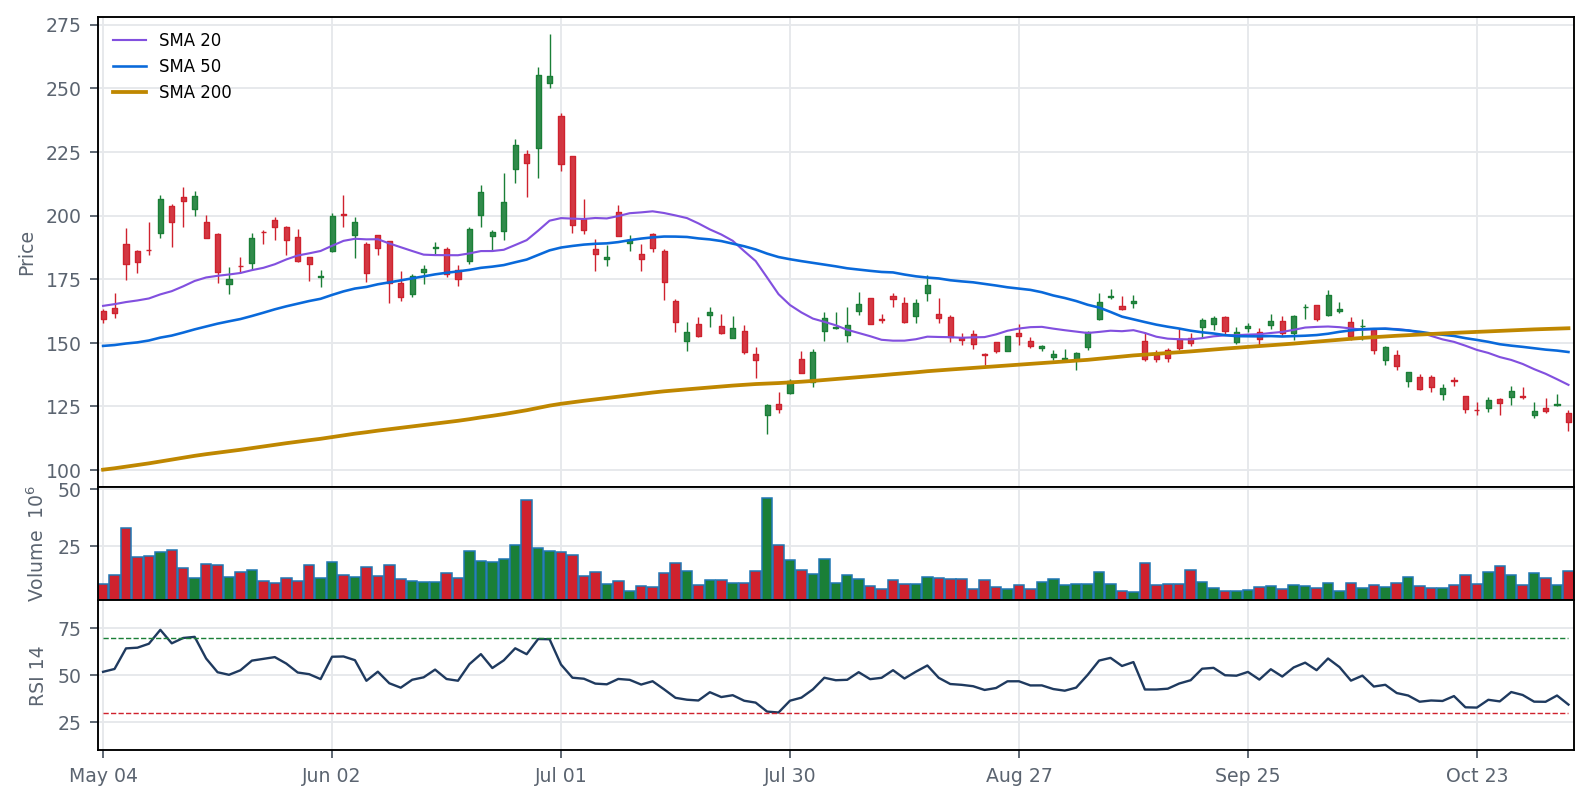
Close $161.08 · −43.0% vs 200-day · RSI 23.0 · TTM EPS growth +552.6% · next earnings Feb 11
BUYBACK + EXEC EXIT AFTER CLOSE 11/4; >30% BELOW 200 SMA
Why it’s down (company specific): Q3 report (Oct 29) beat on revenue, but management said it was 'not yet satisfied' with demand growth and guided TTR sales to the low end of $4.2-4.5B; stock fell 25% in one day.
Coming up: After close Nov 4: $1B buyback (~$500M by end-2026) and Chief Commercialization Officer Tolga Tanguler departing, no replacement named - first trade on this Nov 5. HELIOS-B data at AHA (Nov 6-9; session Nov 9); ISA posters Nov 16-17.
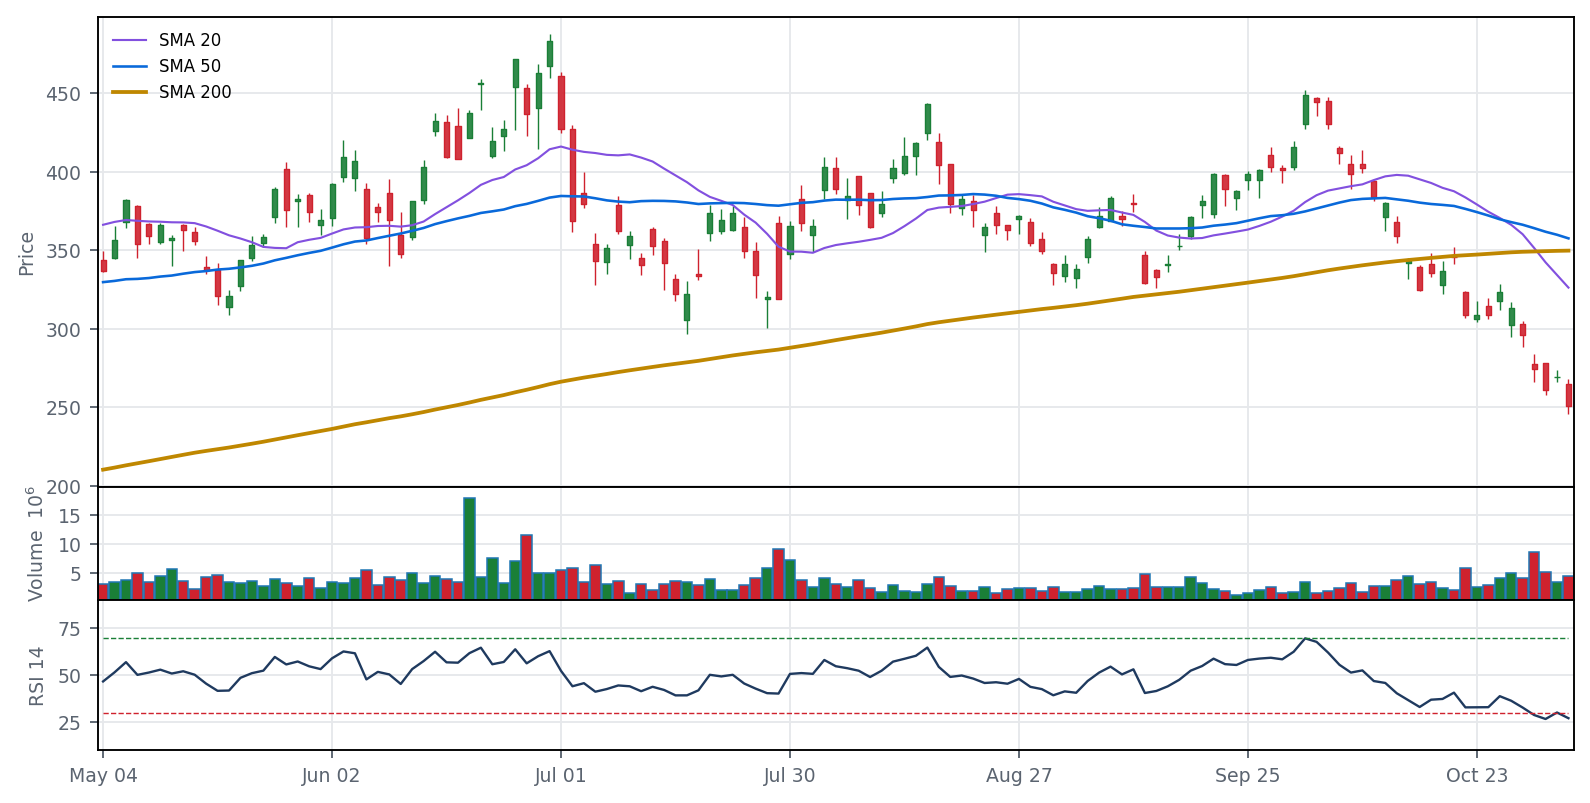
2. TER
Teradyne
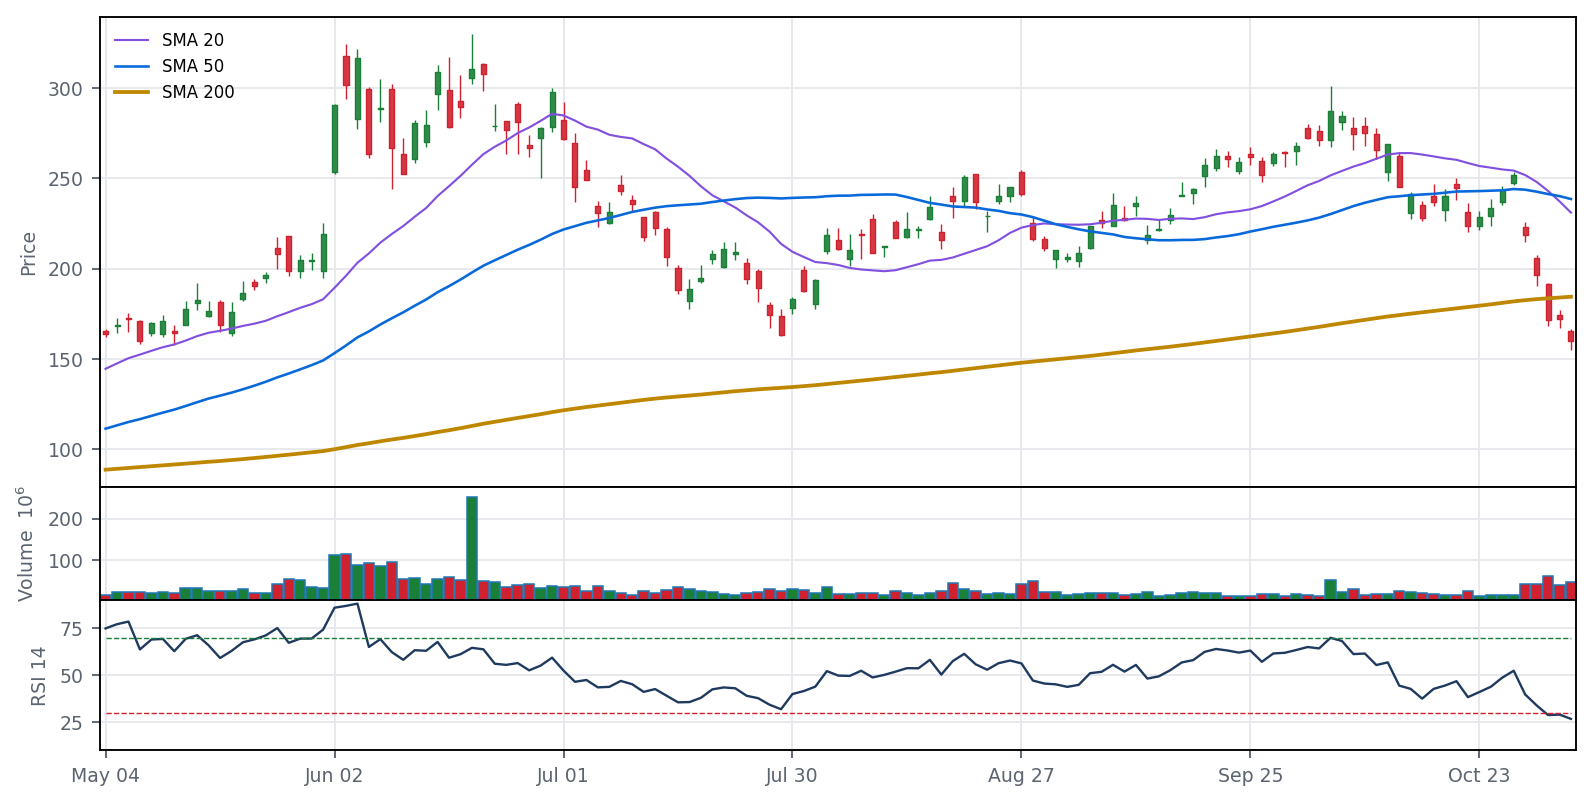
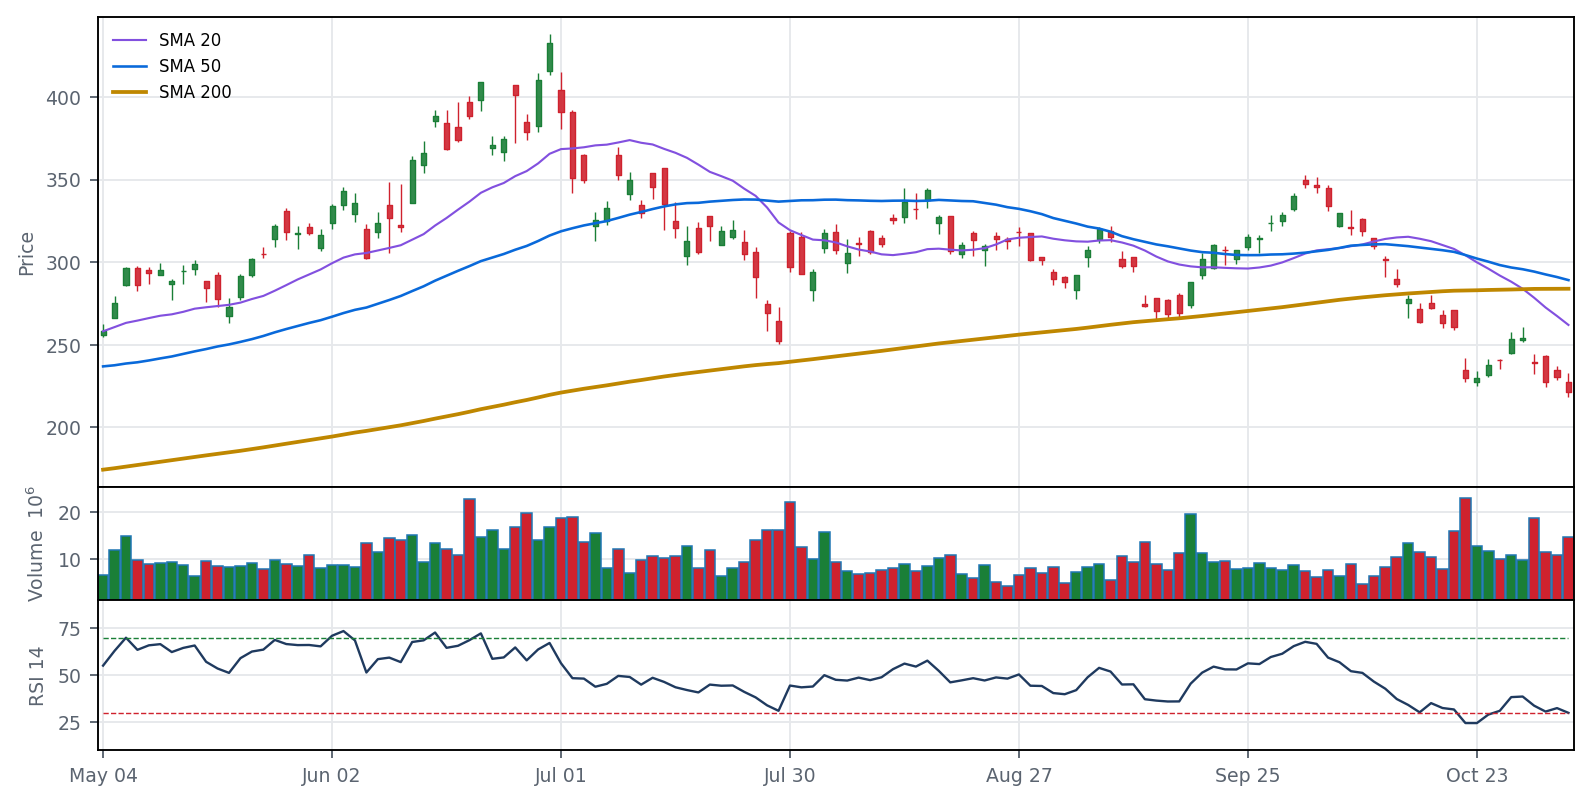
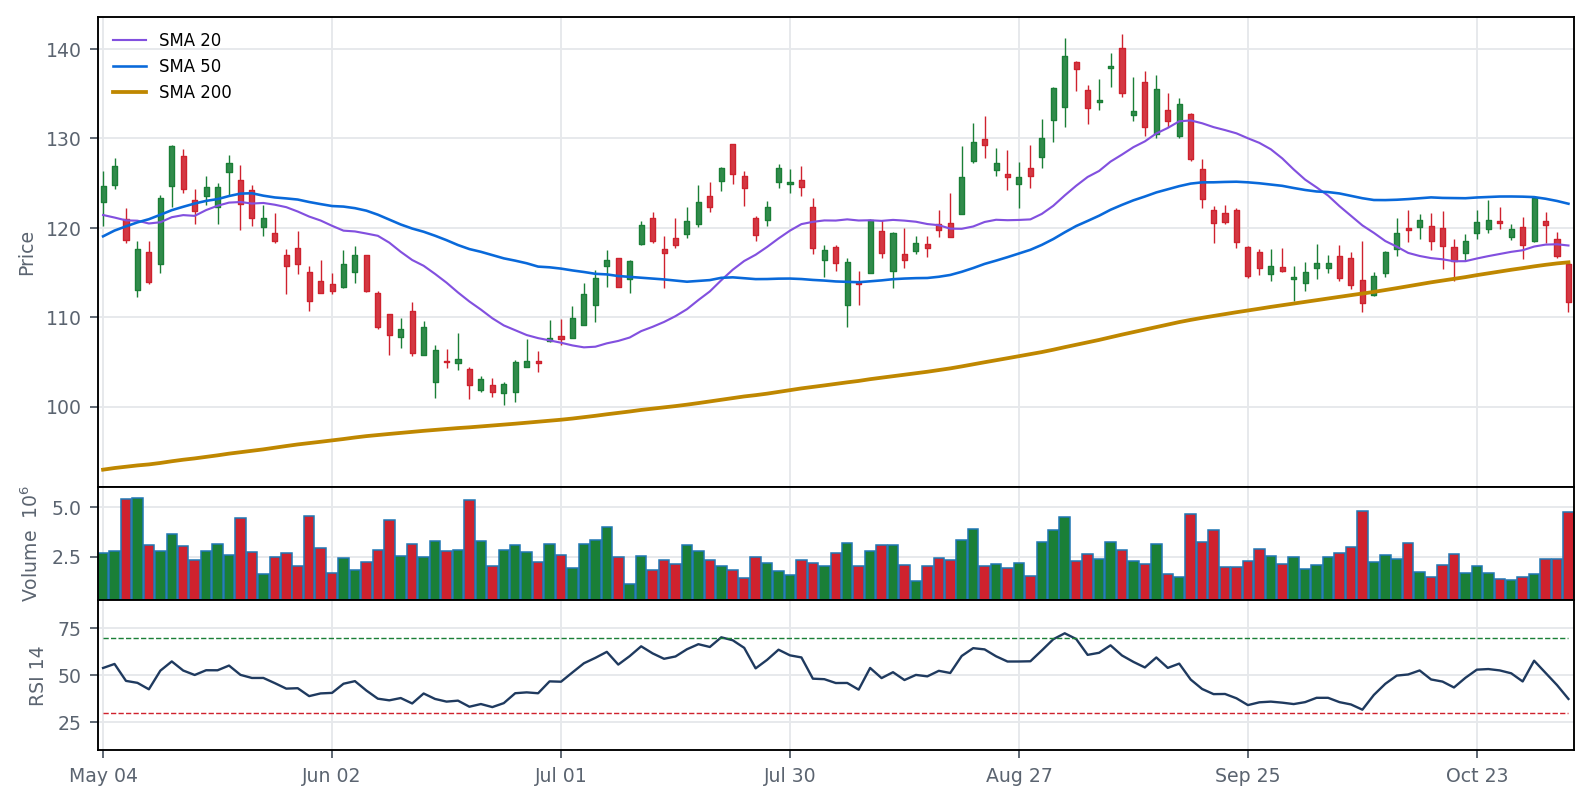
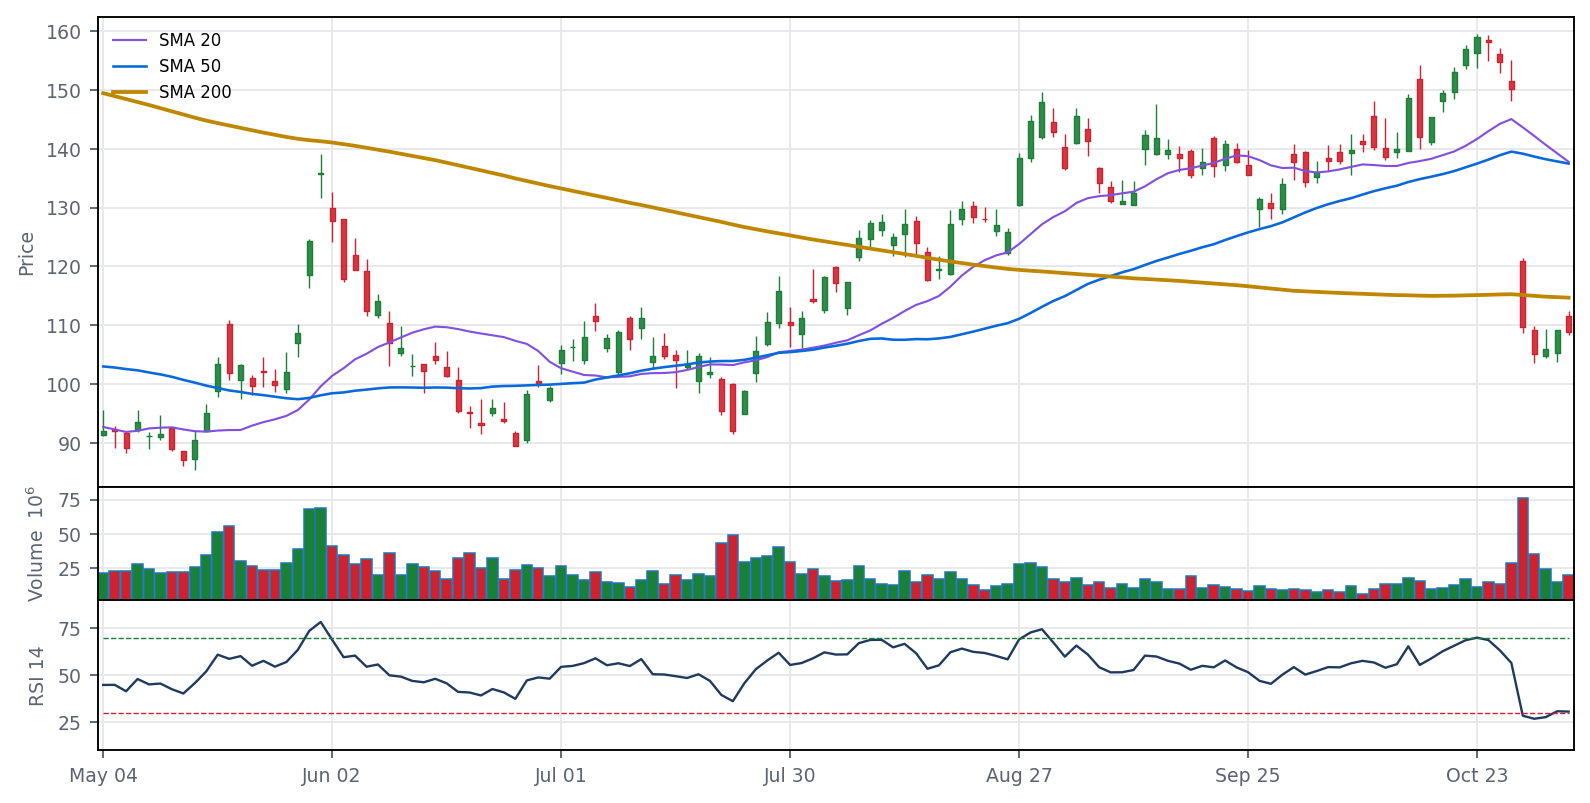
Close $250.99 · −28.3% vs 200-day · RSI 27.1 · TTM EPS growth +192.3% · next earnings Jan 27
Why it’s down (mixed): Q4 guide ($1.25-1.35B) flat with Q3, read as AI test demand peaking; shares gapped down Oct 28 and four firms cut targets. Earlier hits came in AI-hardware selloffs (Aug 18, Sept 14 'AI pacing' warnings, Oct 22 Lam supply warning).
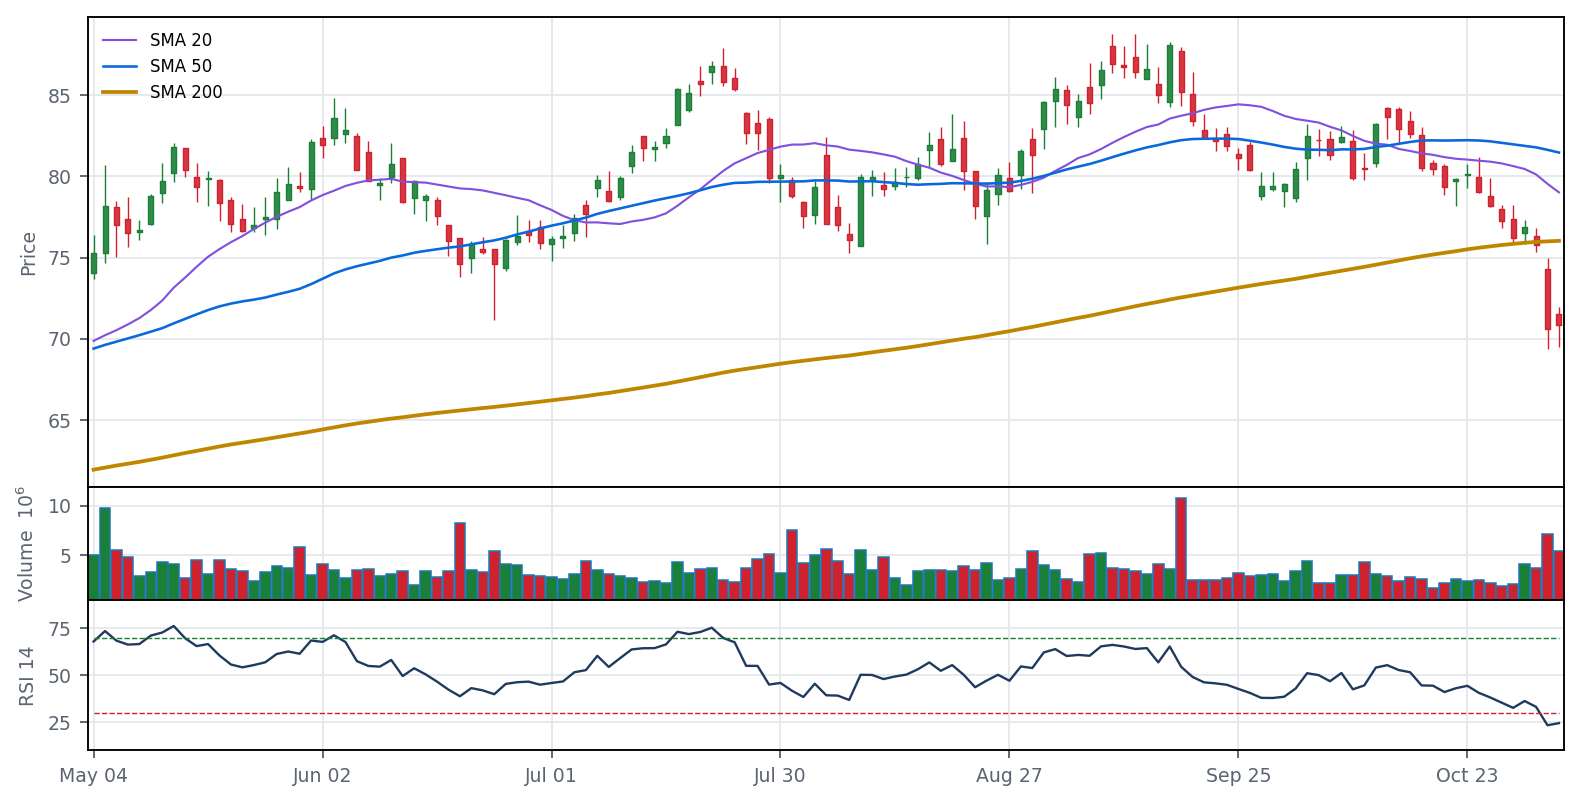
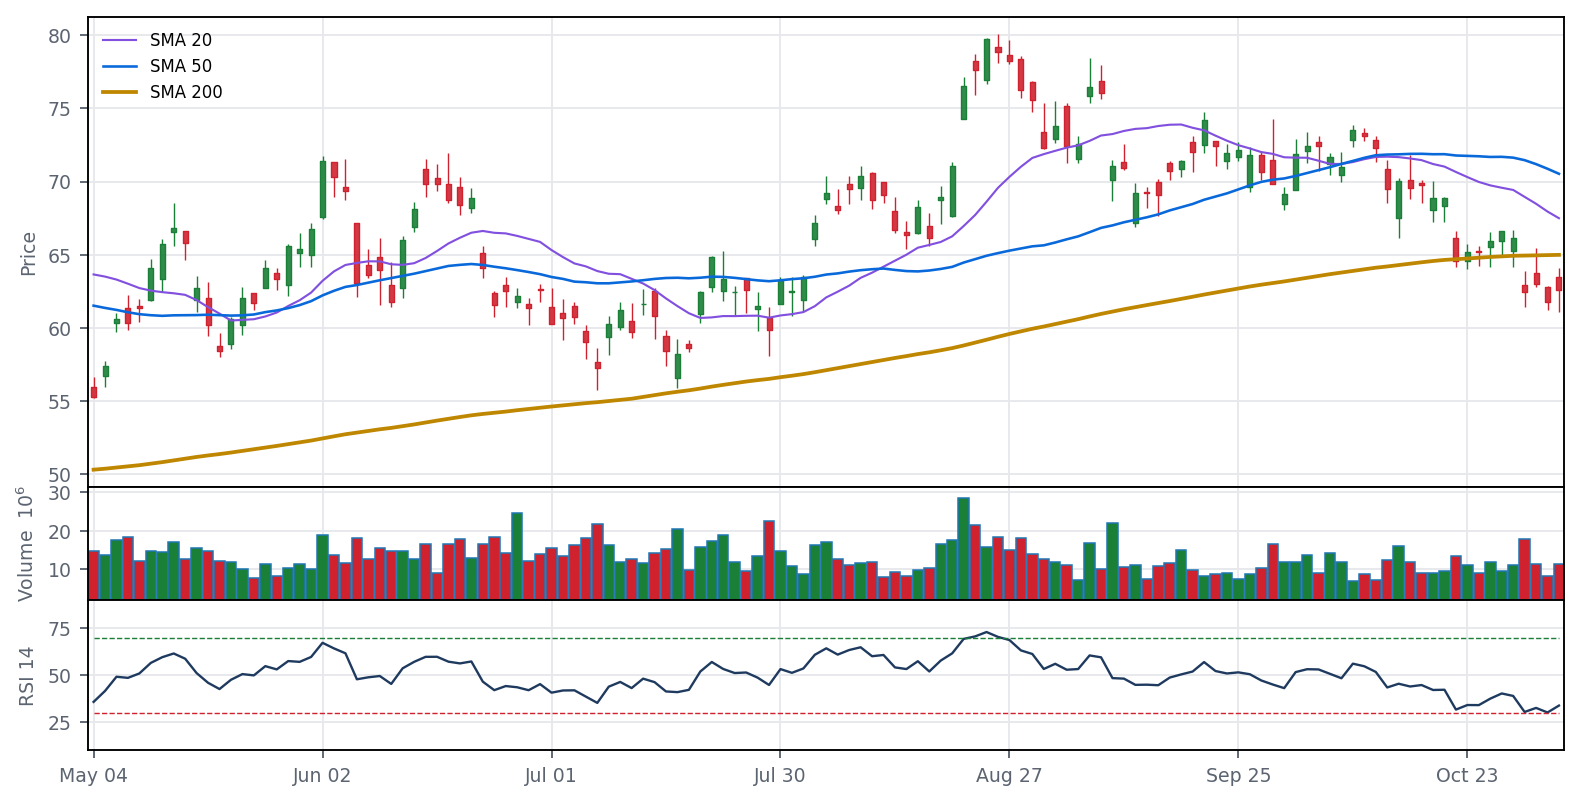
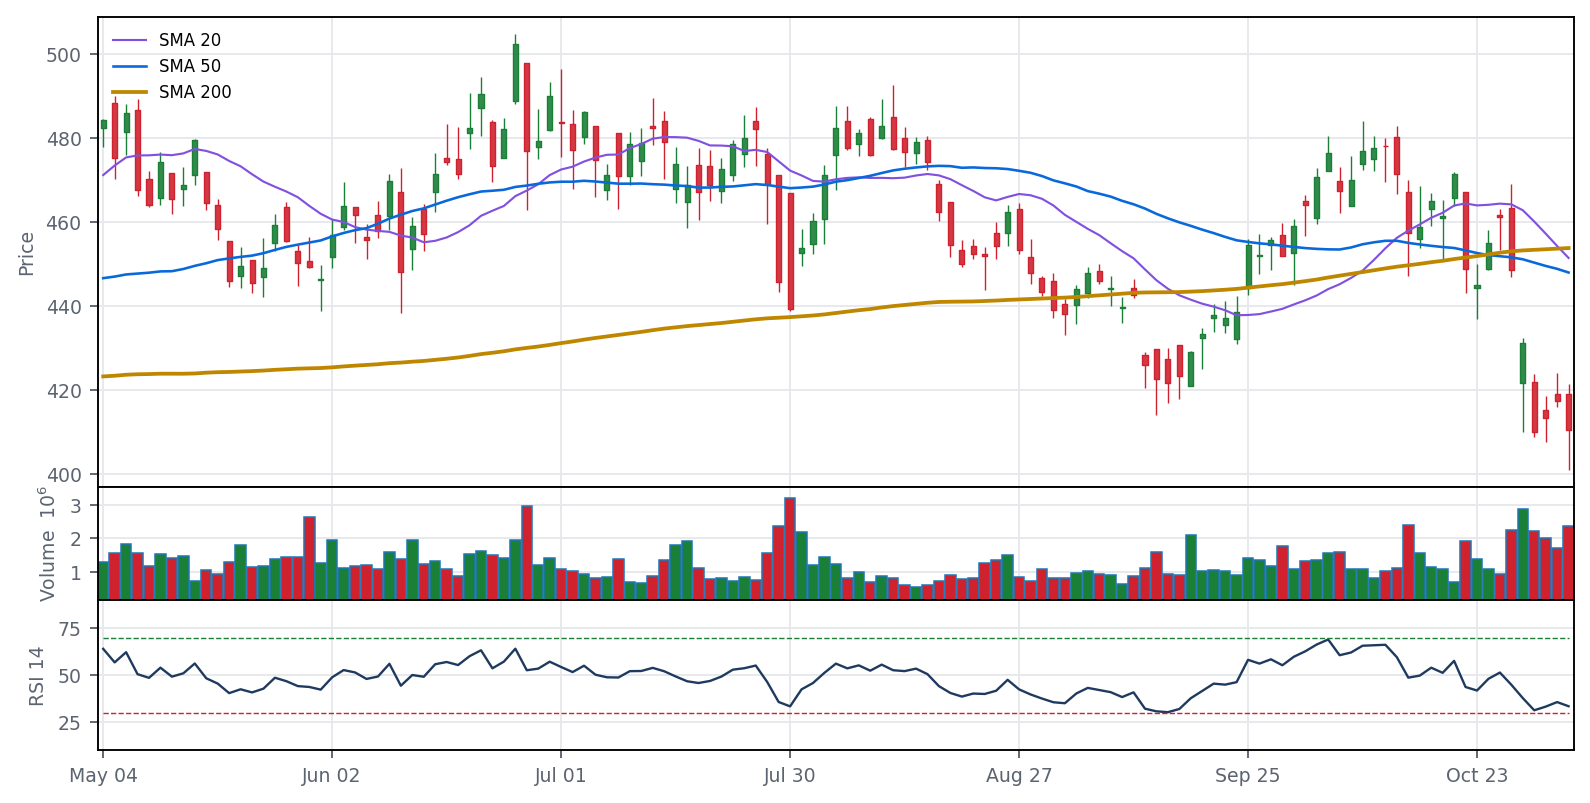
Close $70.84 · −6.8% vs 200-day · RSI 24.5 · TTM EPS growth +40.7% · next earnings Feb 2
Why it’s down (company specific): No single clear headline found. Fell 6.8% on Nov 3 Q3 day despite an EPS beat and a raised 2026 guide; revenue missed, management framed 2027 as similar to 2026, and Q3 had a one-time insurance benefit.
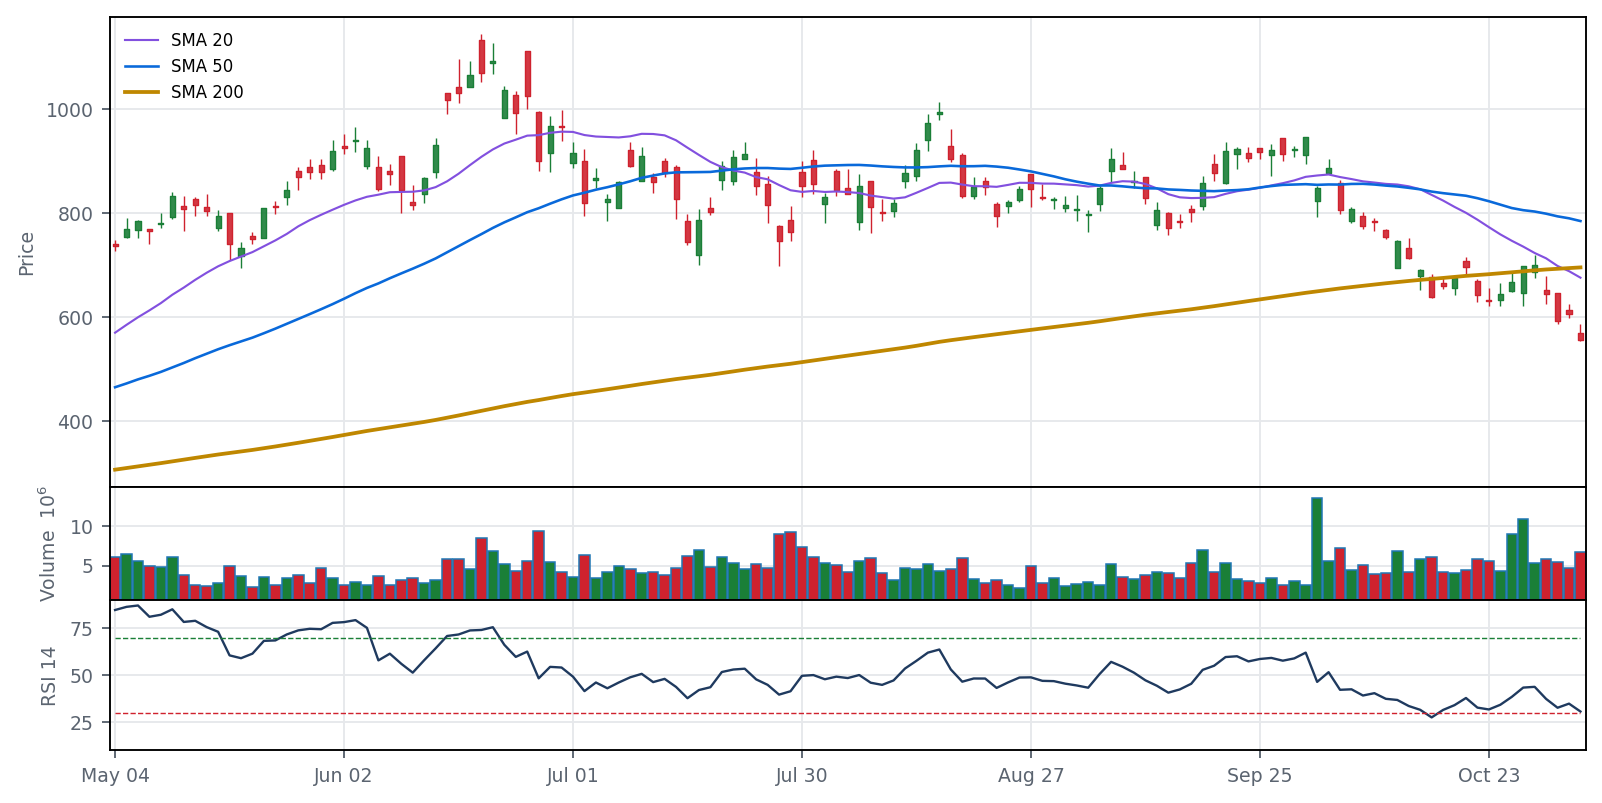
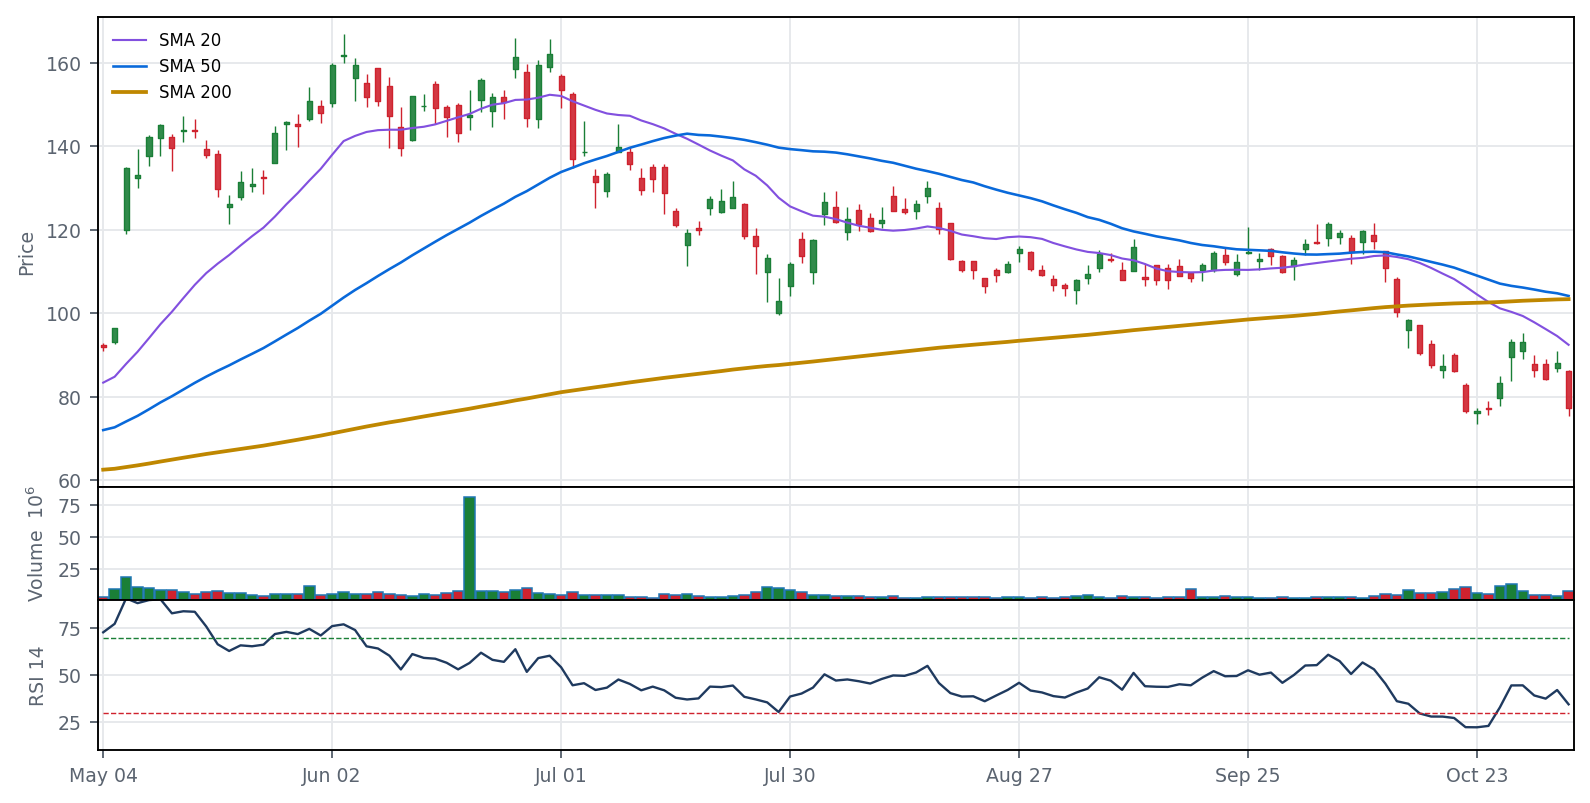
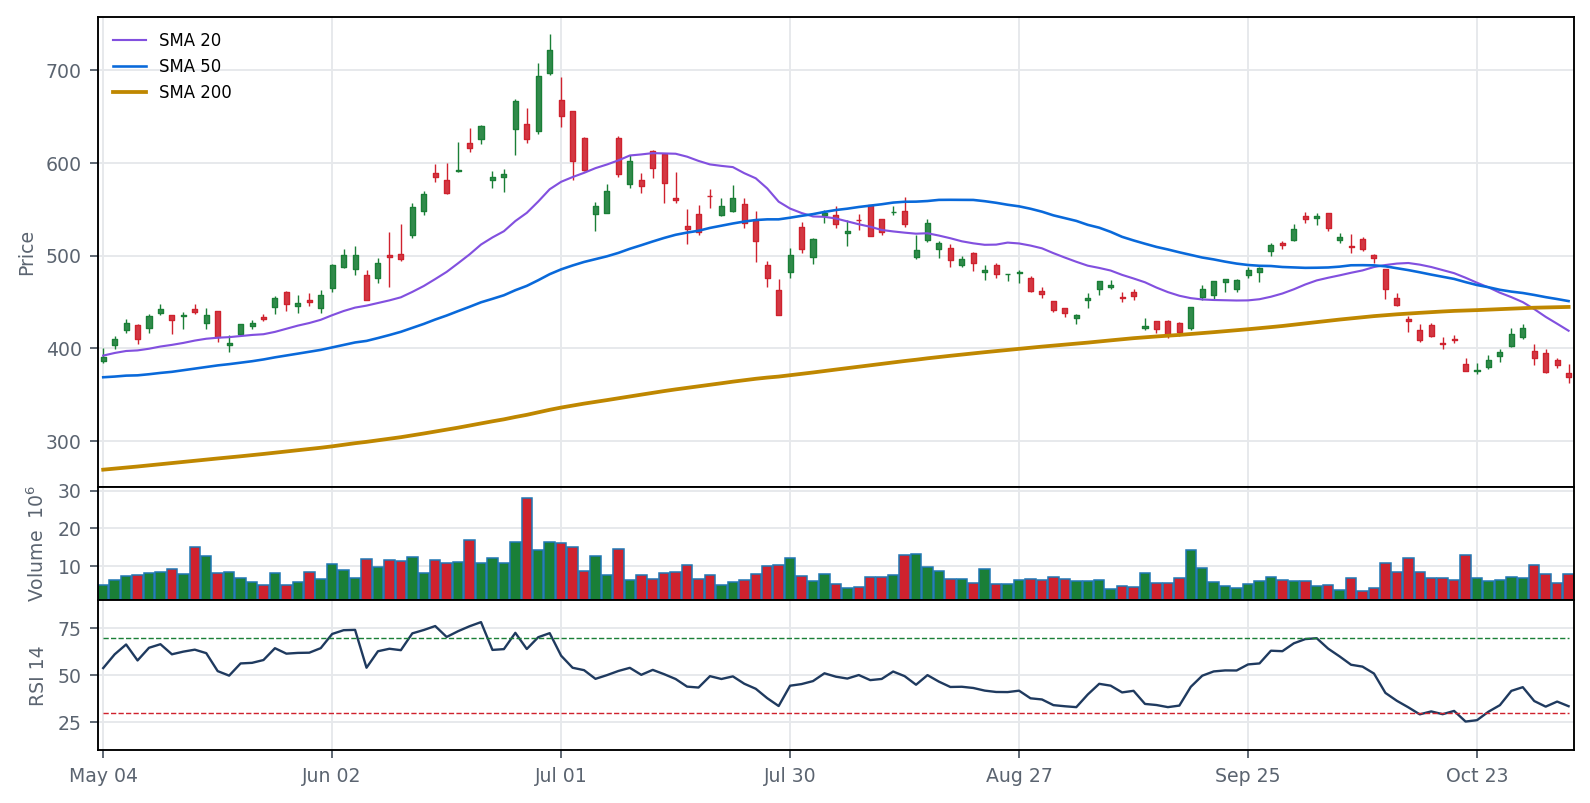
Close $557.06 · −19.9% vs 200-day · RSI 30.7 · TTM EPS growth +125.6% · next earnings Jan 26
Why it’s down (mixed): Oct 2: -10% as Toshiba moved to double HDD output. Oct 6: -9.5% on worries about a costly bidding contest with Toshiba for TDK's heads unit. Nov 4: -8% in the post-election AI data-center selloff plus memory-price worries.
Close $223.27 · −12.8% vs 200-day · RSI 31.5 · TTM EPS growth +103.1% · next earnings Feb 9
Why it’s down (mixed): Q3 (Nov 3) beat and Q4 guide topped consensus, but CFO said initial Scorpio X platforms have completed much of their ramp; most firms cut targets. Also hit in AI-hardware selloffs (Sept 14, Oct 22) and the Nov 4 Democratic-sweep selloff. Nov 2 cause unclear.
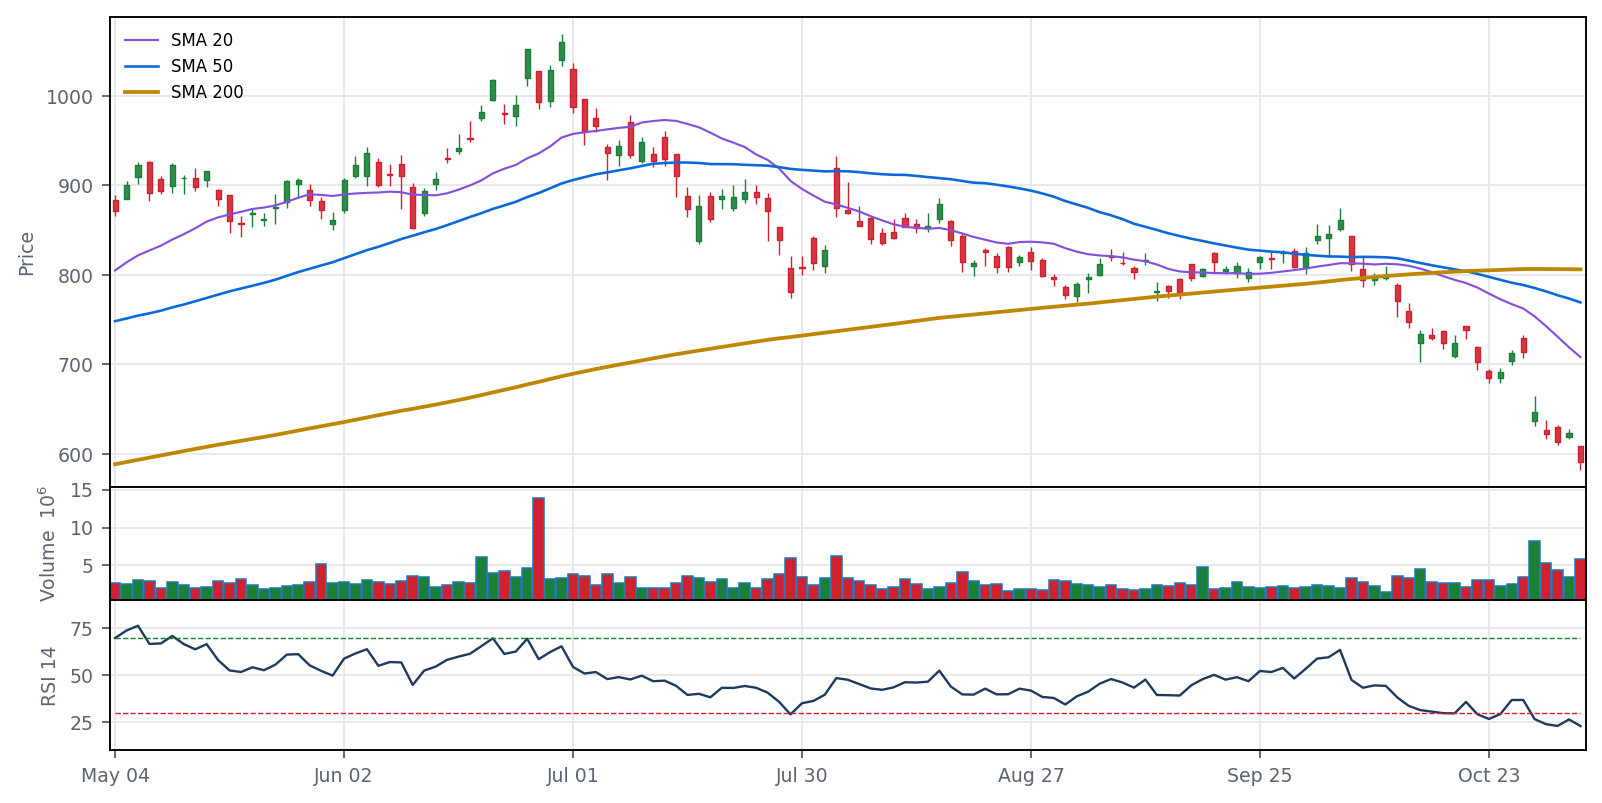
Close $591.30 · −26.7% vs 200-day · RSI 23.0 · TTM EPS growth +36.8% · next earnings Feb 2
Why it’s down (mixed): Oct 29: -9.3% after Q3 - EPS beat but revenue slightly short and a moderate sales outlook, with tariff/margin pressure. Oct 7: -5.7% on FTC/USDA farm-equipment market inquiry. Nov 4: -5.2% as the Democratic sweep hit AI/data-center power names.
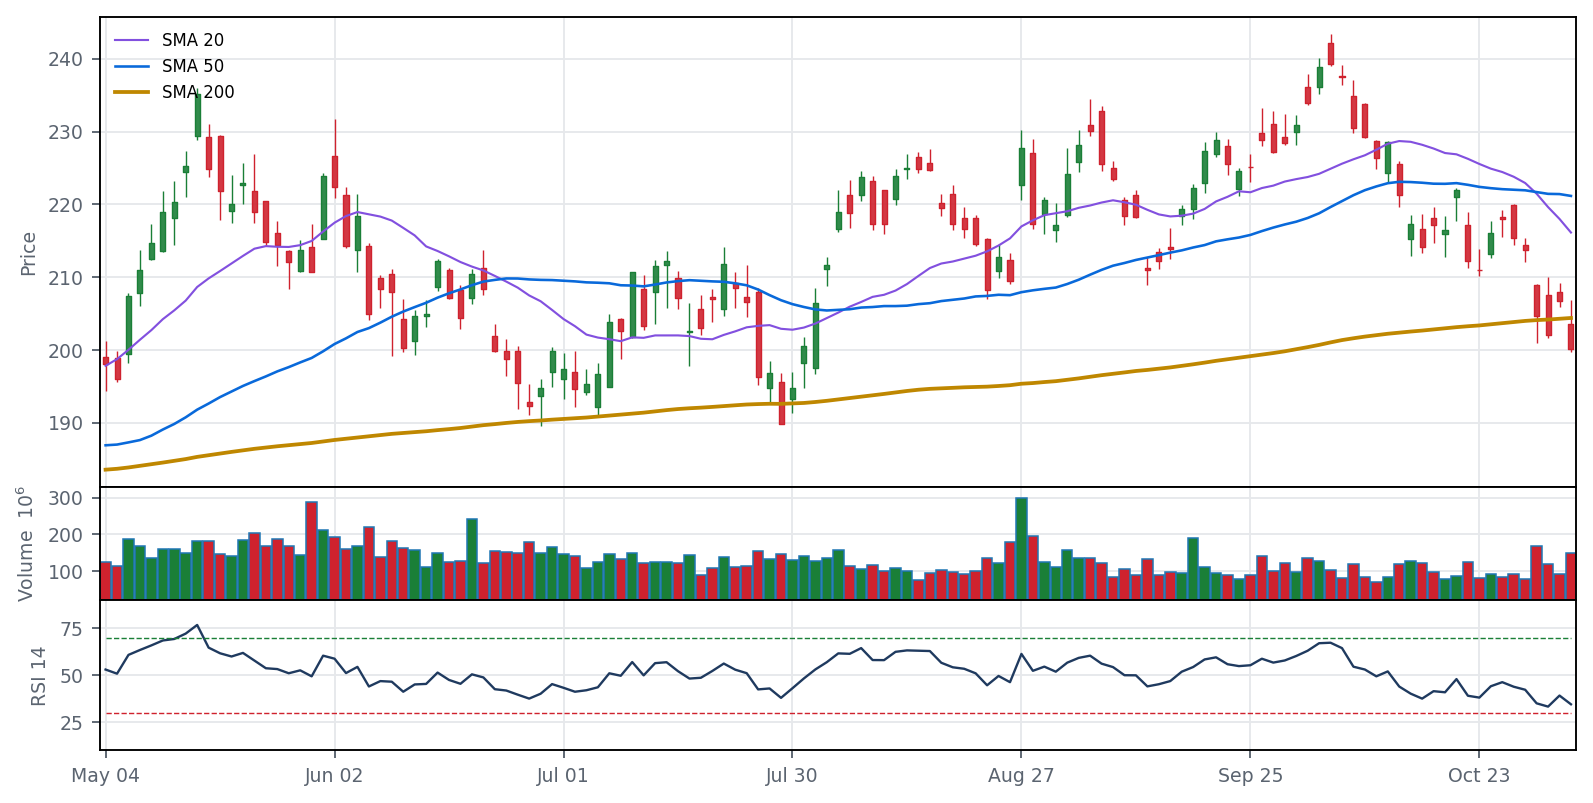
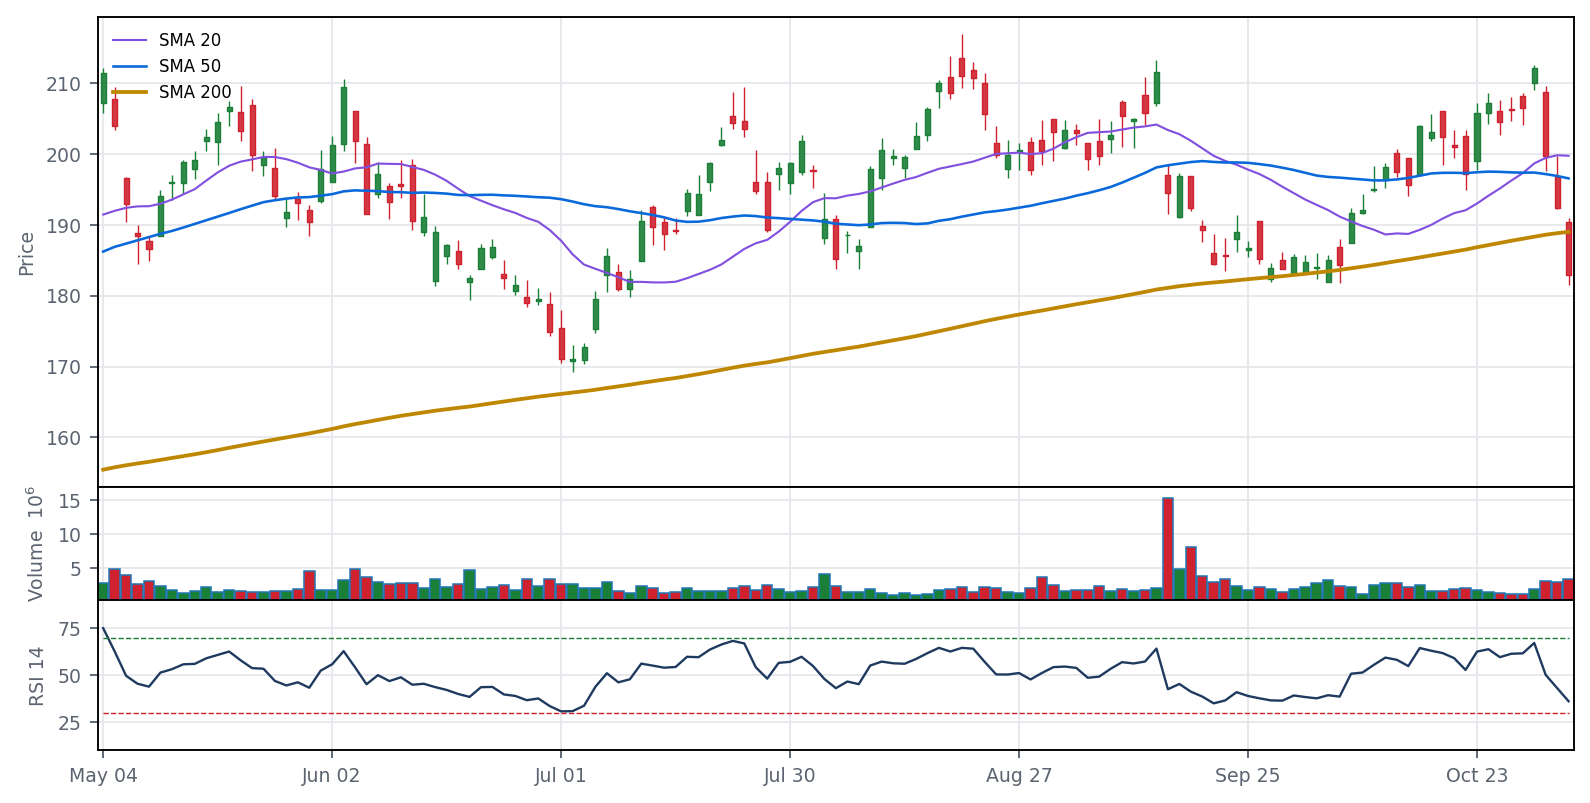
Close $200.13 · −2.1% vs 200-day · RSI 34.5 · TTM EPS growth +96.9% · next earnings Nov 17
EARNINGS IN 13d
Why it’s down (): Not researched.
8. DDOG
Datadog
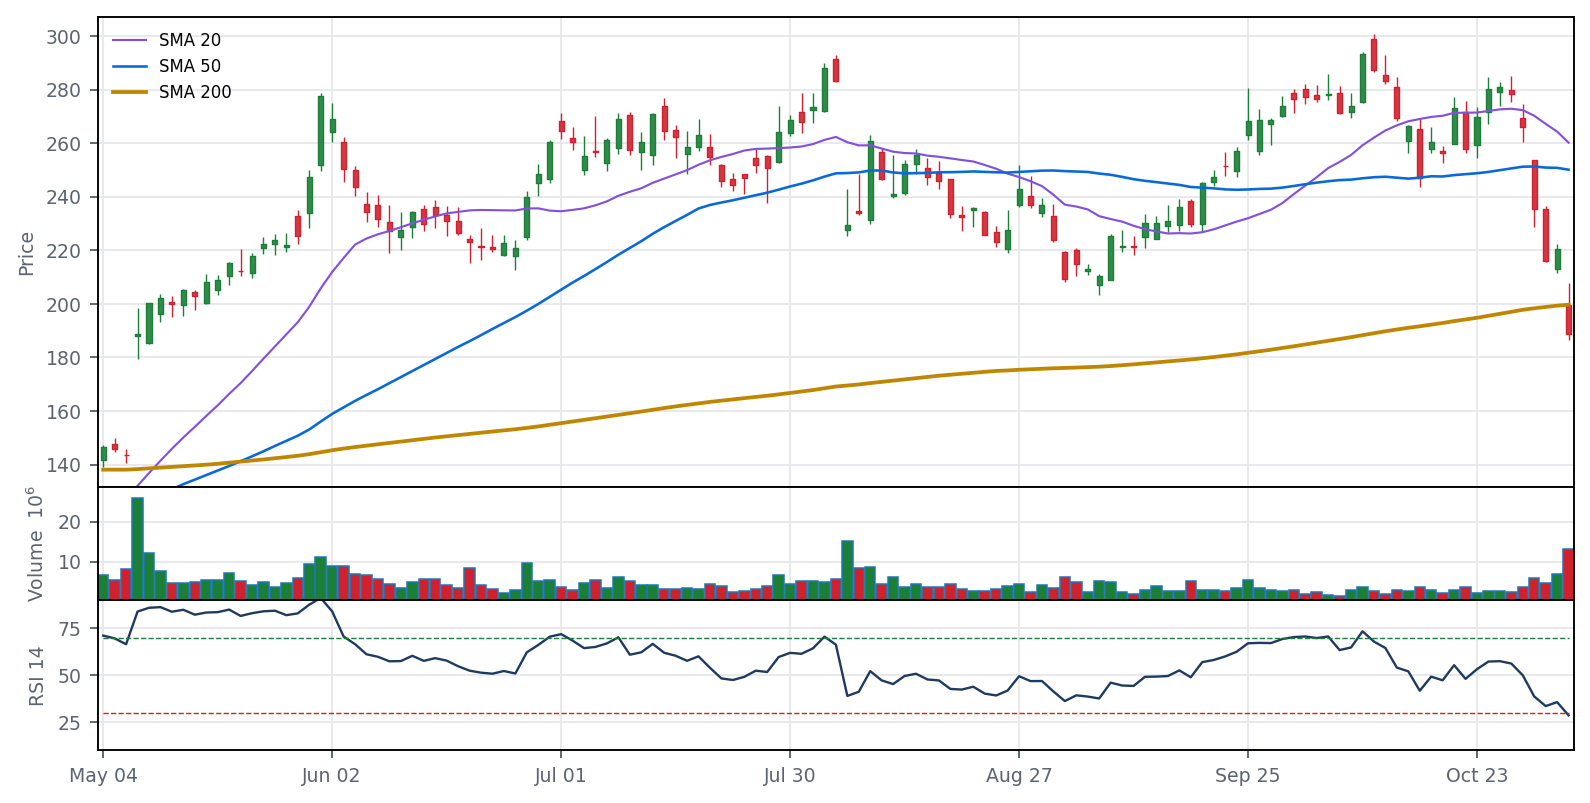
Close $188.72 · −5.5% vs 200-day · RSI 28.7 · TTM EPS growth +35.2% · next earnings –
Why it’s down (mixed): Nov 4: -14% after Q3 beat; Q4 revenue guide only in line (roughly flat sequentially) and the company said lower usage from a major AI customer is weighing on growth. Oct 30: -11.5% in the AI-spending tech selloff with no company news.
Close $44.12 · −3.4% vs 200-day · RSI 31.8 · TTM EPS growth +3.7% · next earnings Nov 5
REPORTS AFTER CLOSE THU 11/5
Why it’s down (sector wide): Oil, not company news: Nov 2 -6.7% as crude fell >7% on US-Iran peace-deal hopes; Nov 4 -7.3% as WTI fell 7.7% to ~$88.67 on post-midterm foreign-policy bets and energy stocks fell 4.8%.
Coming up: Q3 results after close Thu Nov 5. A German report says Devon is selling Eagle Ford assets to Crescent for $4.2B cash, with proceeds to buybacks/debt and more outlook detail at Q3 (single source, unverified).
10. MRVL
Marvell Technology
Close $159.80 · −13.4% vs 200-day · RSI 26.8 · TTM EPS growth +42.2% · next earnings Dec 1
LUMENTUM DEAL: ~50% MORE SHARES
Why it’s down (company specific): Oct 29: -13.2% on a Bloomberg report of Lumentum talks. Nov 2: $115B all-stock deal announced, adding ~50% to share count; by then -32% from Oct 28. Nov 4: -7% as the Democratic sweep hit AI data-center stocks.
Coming up: Lumentum reports Nov 5 (deal-spread read-through); Coherent results (Nov 4 AH) read across to optics; Marvell FQ3 report early December.
11. RDDT
Reddit
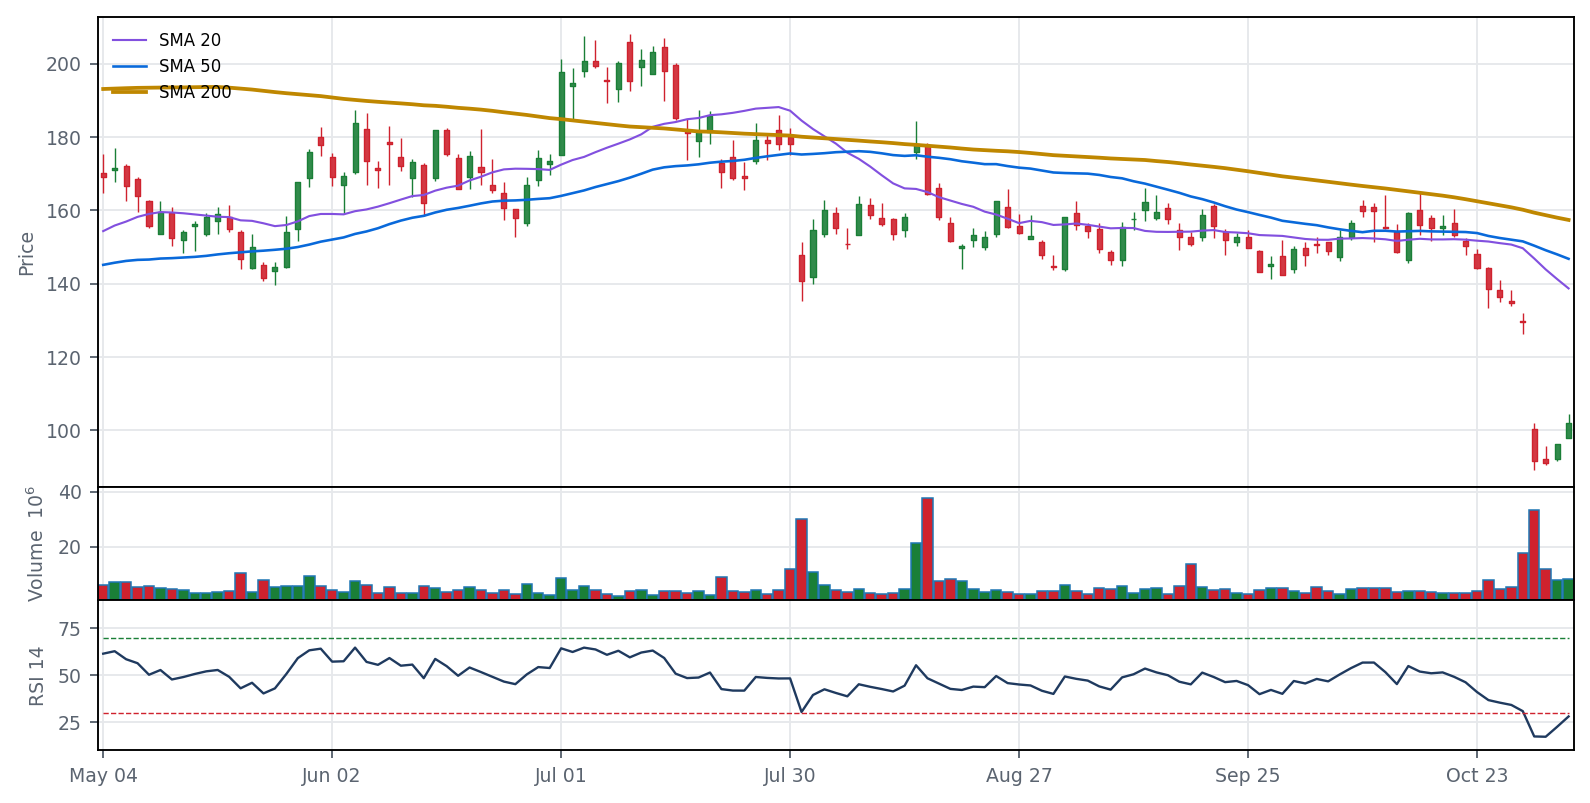
Close $101.89 · −35.3% vs 200-day · RSI 28.1 · TTM EPS growth +114.6% · next earnings Feb 4
>30% BELOW 200 SMA
Why it’s down (company specific): Oct 30: -29% after Q3 despite 54% ad growth; falling Google search referral traffic (AI Overviews/AI Mode), U.S. daily users down 2%, rising costs and marketing spend. Followed by a downgrade and target cuts.
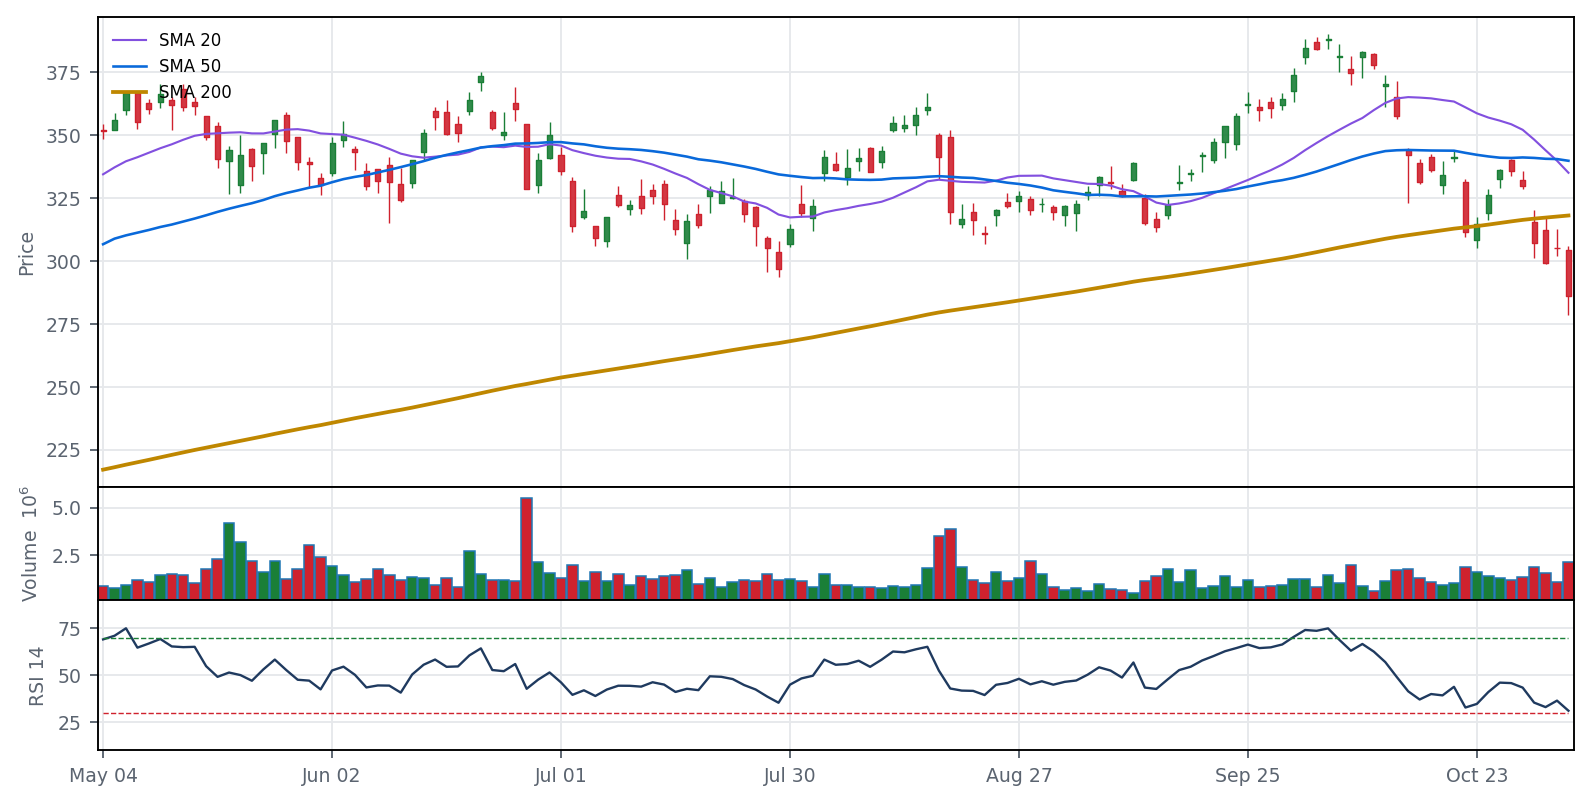
Close $285.86 · −10.1% vs 200-day · RSI 31.1 · TTM EPS growth +45.4% · next earnings Nov 19
Why it’s down (sector wide): No single clear headline found. Worst days (Sept 14, Oct 22, Oct 30) match broad AI-hardware/chip selloff days; a CFO transition was also announced. Down ~22% in 30 days per Simply Wall St.
Coming up: FQ4 results Thu Nov 19 (per company 8-K), just outside the 2-week window.
13. CVS
CVS Health
Close $79.96 · −8.9% vs 200-day · RSI 31.1 · TTM EPS growth +21.6% · next earnings –
SPLITTING INTO TWO COMPANIES
Why it’s down (company specific): Nov 4: -12.5% after announcing a split into a pharmacy company and an Aetna/Caremark company (closing early 2028), overshadowing a Q3 beat and raised guidance; a Leerink analyst called it 'a complete shock.'
Close $221.43 · −22.0% vs 200-day · RSI 30.0 · TTM EPS growth +48.9% · next earnings Jan 27
Why it’s down (mixed): Oct 22: -11.8% after Q3; December guide implied <5% growth, CFO said supply constraints capped it, and China revenue share to fall 'meaningfully.' Also hit in sector selloffs Sept 14 (AI pacing) and Oct 30 (Intel-led rout).
Coming up: Applied Materials earnings Nov 12 (peer read-through).
15. FANG
Diamondback Energy
Close $182.88 · −3.2% vs 200-day · RSI 36.2 · TTM EPS growth +31.4% · next earnings Feb 22
Why it’s down (sector wide): Oil-driven. Nov 2: -5.8% as crude fell >7% on US-Iran peace-deal hopes; Nov 4: -4.9% as WTI fell 7.7%. Sept 16 -8%: no specific trigger identified. Q3 (Nov 2) beat on production.
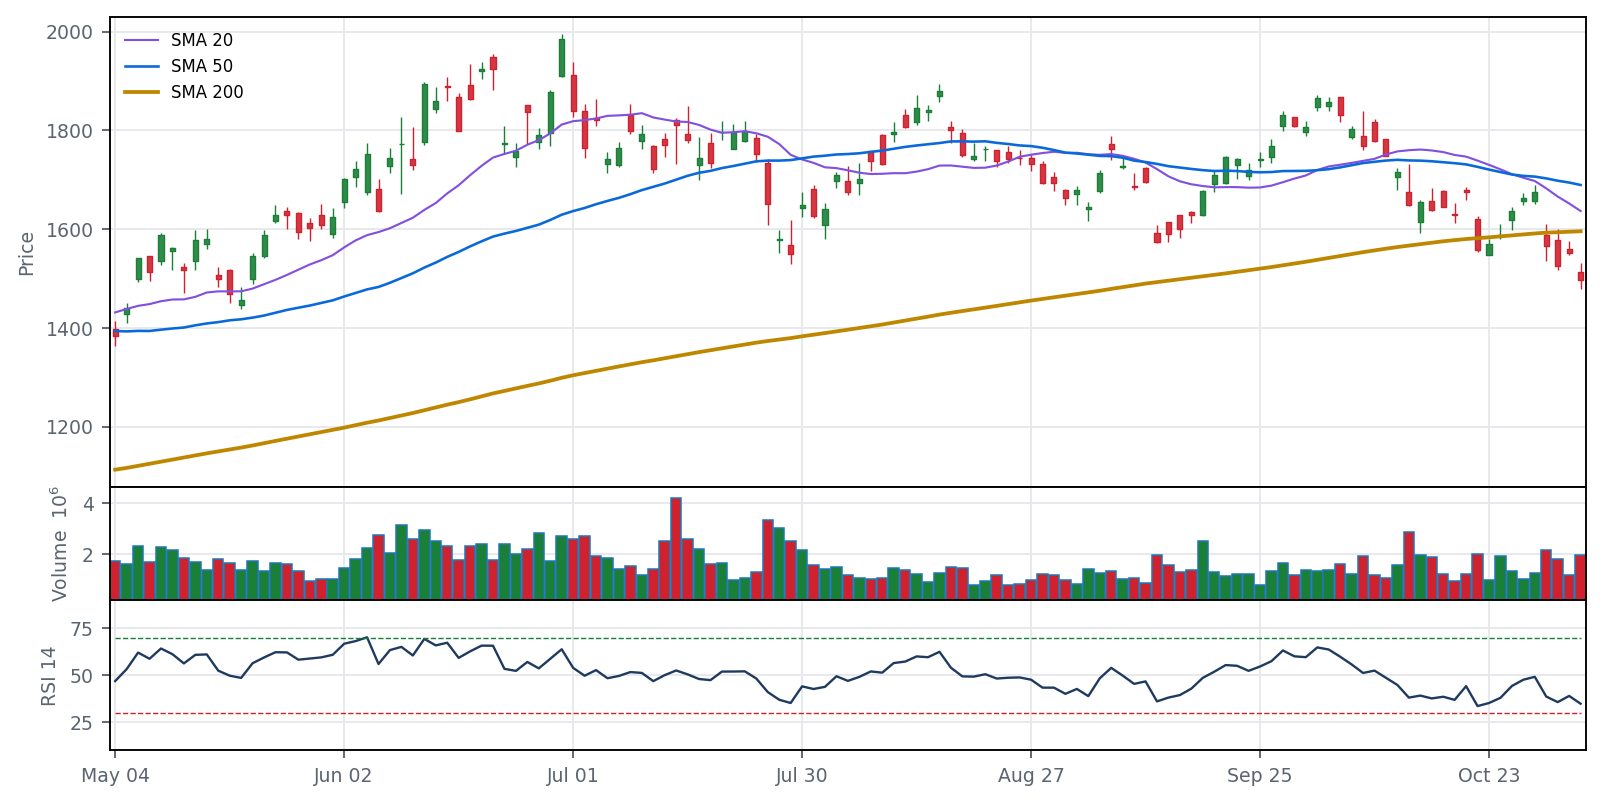
Close $1,496.30 · −6.2% vs 200-day · RSI 34.9 · TTM EPS growth +39.9% · next earnings Jan 27
Why it’s down (sector wide): Sector selloffs: Sept 14 (AI-lab 'pacing' warnings), Oct 22 (Lam supply warning), Oct 30 -6.1% in the Intel-led chip rout after Intel's weak forecast, Nov 3 European chips fell on Apple's memory-cost margin warning. No ASML-specific negative headline.
Close $195.09 · −34.2% vs 200-day · RSI 33.1 · TTM EPS growth +62.4% · next earnings –
BEAT & RAISED AFTER CLOSE 11/4 - UP ~5% OVERNIGHT; >30% BELOW 200 SMA
Why it’s down (sector wide): AI-optics selloffs, not company news: Aug 10 -14% pre-earnings de-risking, Aug 18 AI-hardware rotation, Sept 14 -11% with Corning's stock-sale/AI-pacing day, Nov 4 -6% on Democratic sweep. After Nov 4 close: beat-and-raise, shares +5% overnight.
Coming up: Nov 5 first full session on results: FQ1 adj EPS $2.09 (~10c beat); FQ2 guide rev $2.55-2.75B vs $2.54B est, EPS $2.28-2.48 vs $2.21; FY27 growth >60% pro forma. Lumentum also reports Nov 5.
18. FCX
Freeport-McMoRan
Close $62.60 · −3.7% vs 200-day · RSI 33.9 · TTM EPS growth +67.3% · next earnings Jan 21
Why it’s down (mixed): Copper-driven: Sept 10 -6.6% as copper retreated from a record on surging yields and U.S. copper-tariff uncertainty. Oct 22 and Oct 30 drops: no single clear headline found (broad selloff days). Q3 (Oct 27) trimmed 2026-27 copper sales guidance.
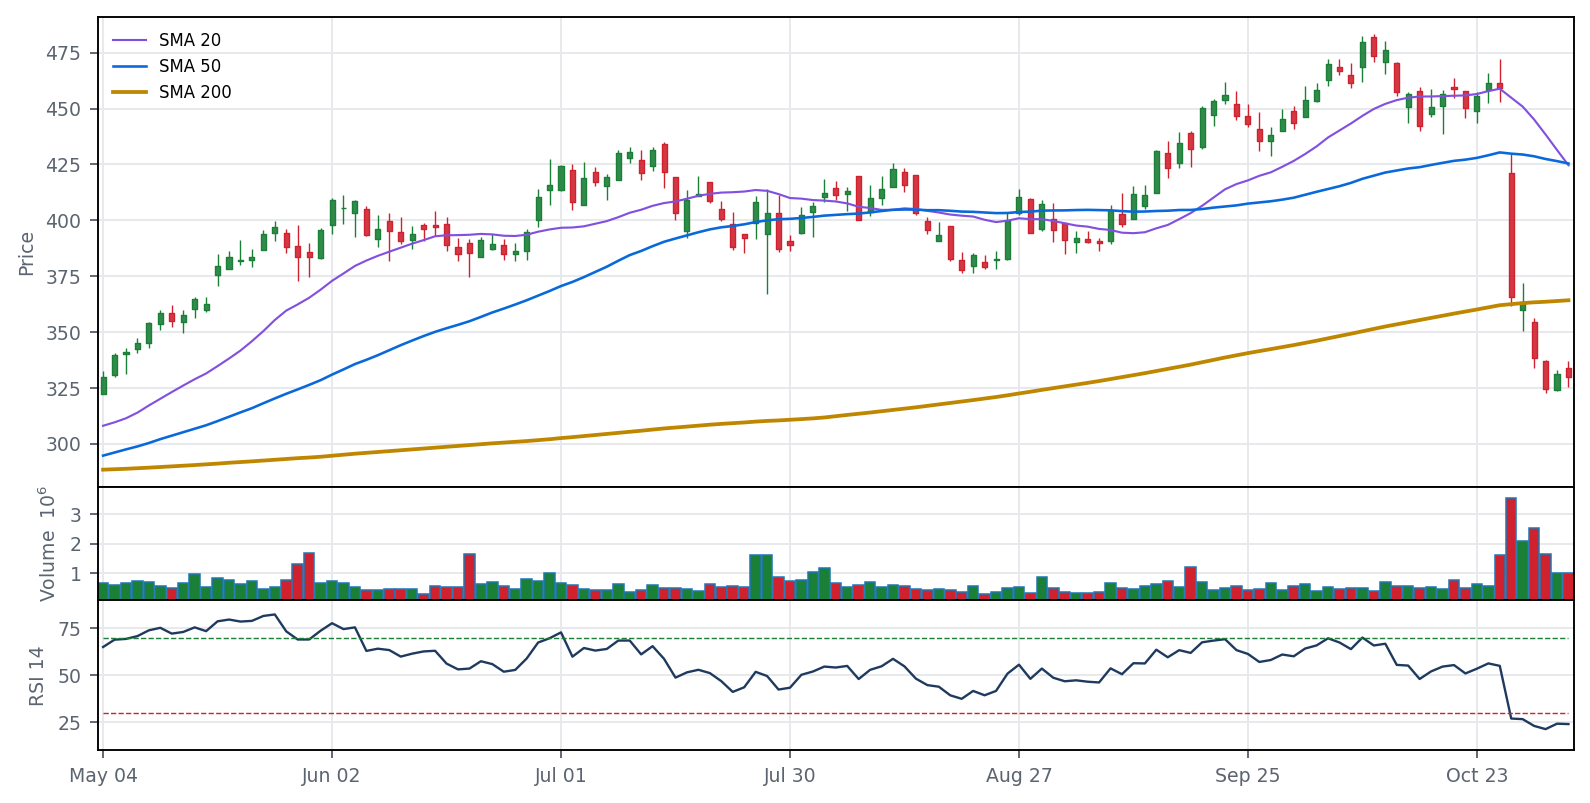
Close $329.72 · −9.5% vs 200-day · RSI 24.0 · TTM EPS growth +10.7% · next earnings Jan 26
Why it’s down (company specific): Oct 28: -20.4% after FQ4 beat; FY27 revenue growth guided to 8-9% (vs 11% in FY26), gross-margin outlook hit by higher component costs, and operating cash flow fell. Oct 30: -6.9% in a broad software/tech selloff.
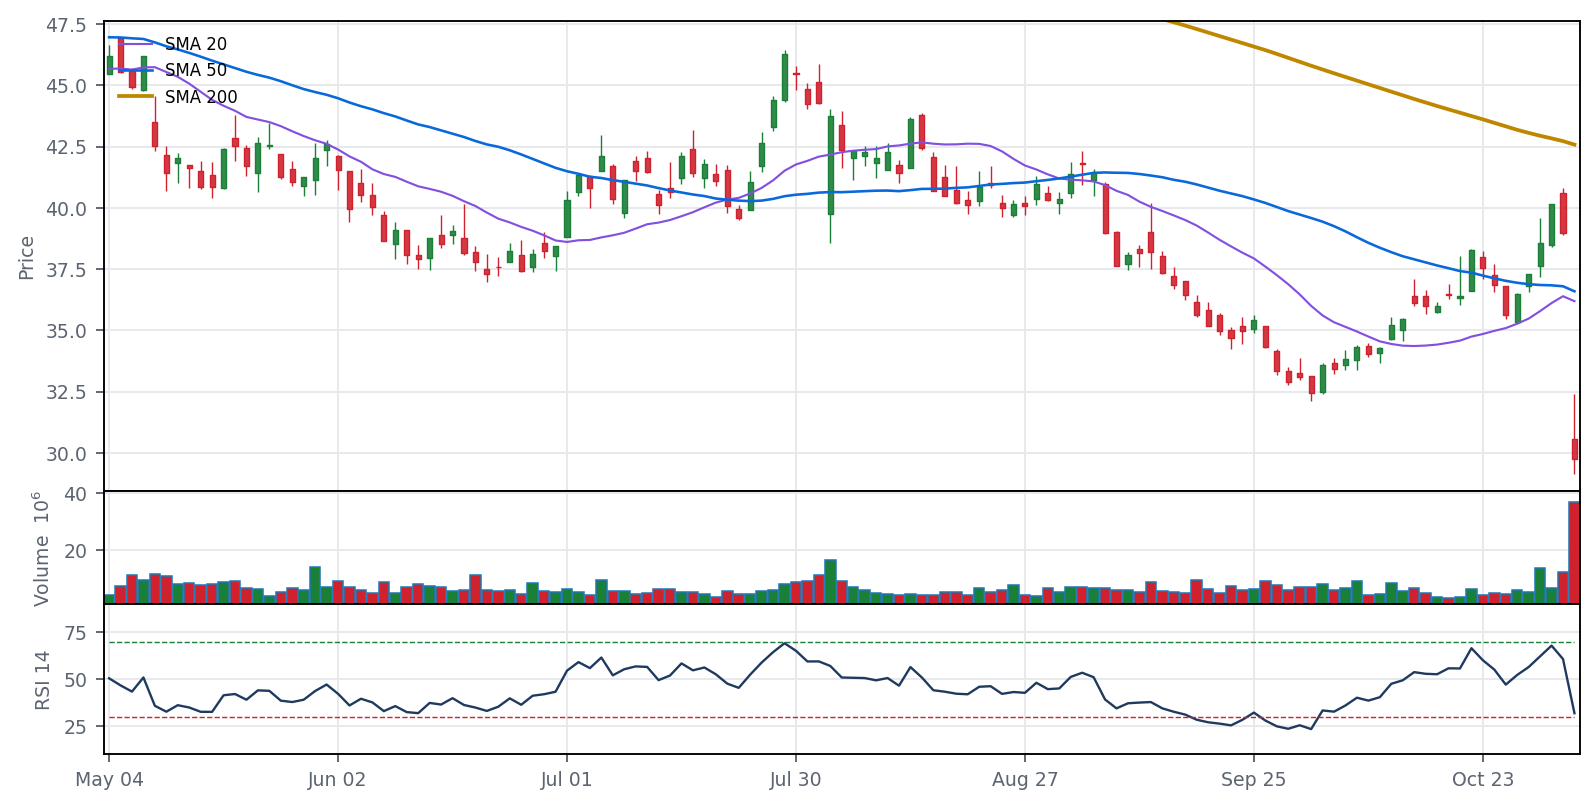
Close $29.76 · −30.1% vs 200-day · RSI 31.9 · TTM EPS growth +12.1% · next earnings –
>30% BELOW 200 SMA
Why it’s down (company specific): Nov 4: -23.7% (14-year low) after Q3 beat; full-year guide implies slowing organic growth (~3.4%) and EBITDA growth, CFO James Kehoe abruptly stepping down, and JPMorgan downgraded to Neutral. Net debt >$14B from the Global Payments issuer deal.
Close $49.87 · −16.9% vs 200-day · RSI 33.2 · TTM EPS growth +7.1% · next earnings Jan 25
Why it’s down (mixed): Sept 10: -6.5% after CEO warned at a Barclays conference of Chart integration costs/weaker margins and cut FCF conversion target. Oct 28: -7.4% as Q3 GAAP profit fell 33% on Chart costs despite a beat. Nov 4: -5.5% with energy as oil fell 7.7%.
Close $111.68 · −3.8% vs 200-day · RSI 37.4 · TTM EPS growth +62.3% · next earnings –
REPORTED AFTER CLOSE 11/4 - MIXED
Why it’s down (mixed): No single clear headline found. Nov 4 -4.4% came as oil fell 7.7% on post-midterm Iran-policy bets; CF's own outlook leans on Iran-war disruption of Middle East urea supply. Sept 18/21 drops unexplained.
Coming up: Nov 5 first trade on Q3 (reported 4:30pm ET Nov 4): EPS miss vs Zacks, revenue beat, $367M Q3 buybacks, constructive nitrogen outlook; Yazoo City outage persists. No verified after-hours move found.
23. TT
Trane Technologies
Close $410.48 · −9.5% vs 200-day · RSI 33.5 · TTM EPS growth +14.4% · next earnings Jan 28
Why it’s down (mixed): Q3 (Oct 29) was mixed - revenue slightly below expectations and bookings decelerated sequentially; Oppenheimer cut its target to $500 from $530 and shares fell 3.9% Oct 30 amid the AI-spending selloff. Oct 22 drop: no clear headline.
Coming up: Presenting at the Baird Global Industrial Conference (announced Nov 4).
24. FLEX
Flex Ltd.
Close $77.24 · −25.3% vs 200-day · RSI 34.5 · TTM EPS growth +32.2% · next earnings Jan 27
Why it’s down (mixed): Mid-Oct: -7% on Axiom spin-off financing risk (Flex guarantees $2B Axiom preferred). Oct 22: AI-hardware selloff (low $73.48 on Oct 23). Nov 4: -13% on Texas data-center moratorium fears after Democratic wins, despite an Oct 28 earnings beat.
Close $118.77 · −23.7% vs 200-day · RSI 34.4 · TTM EPS growth +30.7% · next earnings Jan 26
Why it’s down (mixed): Sept 14: -13.7% after disclosing a $2B at-the-market stock sale (dilution) on the AI-pacing selloff day. Aug 18 and Oct 22: AI-hardware/chip selloffs. Q3 (Oct 27) beat, so the slide is mostly sector plus the equity raise.
Close $108.81 · −5.1% vs 200-day · RSI 30.7 · TTM EPS growth +14.2% · next earnings Jan 27
Why it’s down (company specific): Oct 29: -26.9%, worst day in a year, after Q3 adj EPS $1.00 missed $1.02; Q4 subscription growth guided to 18.5% and full-year margin trimmed to 31.5%, deepening AI-disruption fears for software.
Close $369.40 · −16.9% vs 200-day · RSI 33.5 · TTM EPS growth +14.0% · next earnings Nov 12
EARNINGS IN 8d
Why it’s down (sector wide): Sector-driven: chip-equipment selloff after its Oct 13 investor event amid AI-spending worries, Lam's Oct 21 supply/China warning (Oct 22), and -7.5% on Oct 30 after Intel's weak forecast spread across chips. Down 29% in a month.
Coming up: FQ4 earnings after close Thu Nov 12; guide rev $10.25B +/- $0.5B, non-GAAP EPS $4.02 +/- $0.20, GM 50.4%; watch China and 2027 WFE commentary.
28. KMI
Kinder Morgan
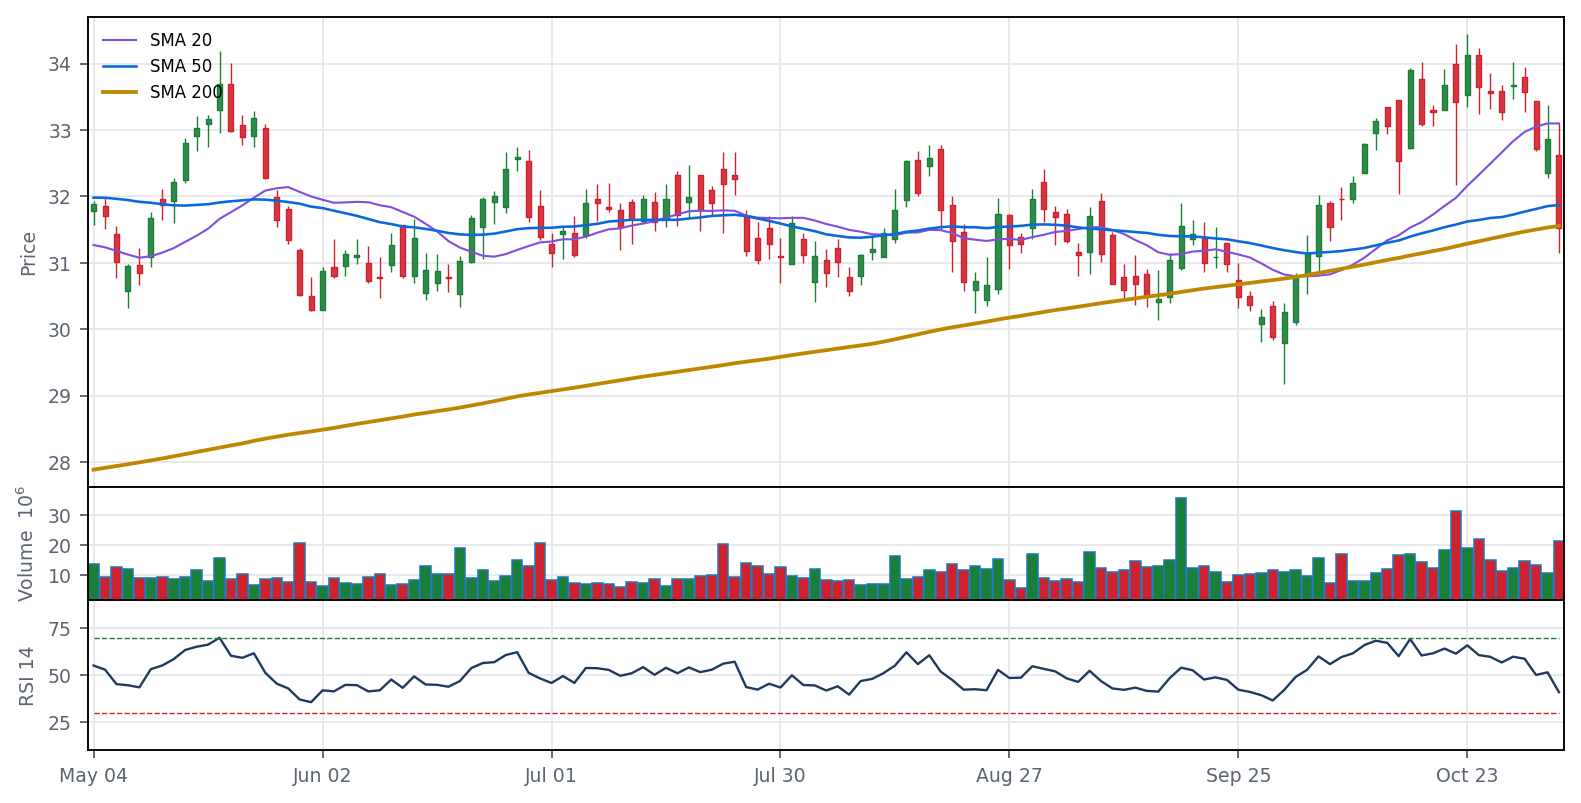
Close $31.52 · −0.1% vs 200-day · RSI 41.0 · TTM EPS growth +29.3% · next earnings Jan 27
Why it’s down (sector wide): No single clear headline found. Small dips tracked the energy selloff: oil fell >7% Nov 2 on US-Iran peace hopes and 7.7% Nov 4 (energy sector -4.8%). Morgan Stanley trimmed its target to $39 from $40.
Close $67.86 · −5.5% vs 200-day · RSI 39.4 · TTM EPS growth +14.9% · next earnings Feb 9
Why it’s down (mixed): No single clear headline found. Nov 4 -6.4% coincided with the energy selloff (WTI -7.7%) and the post-election selloff in AI data-center power plays, where Williams is building gas power; Q3 adj EPS missed by 1c on higher costs.