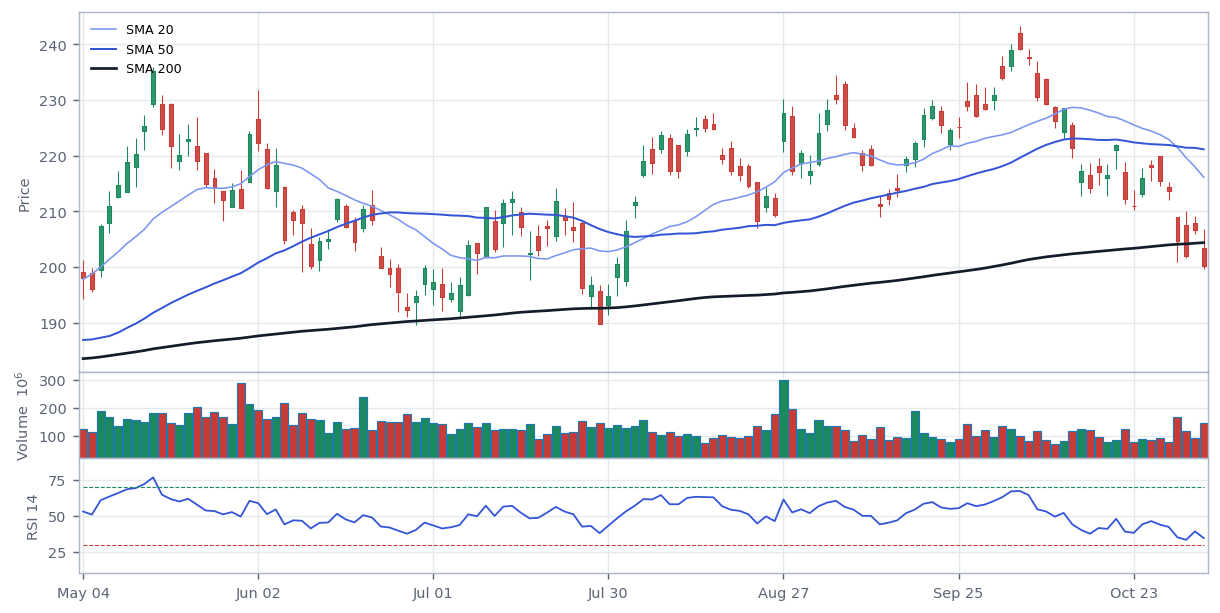
- 5 days
- −7.1%
- From 52-wk high
- −16.3%
- vs 200-day
- −2.1%
- RSI 14
- 34.5
- 1 month
- −16.3%
- Next earnings
- Tue Nov 17
Daily candles, 6 months
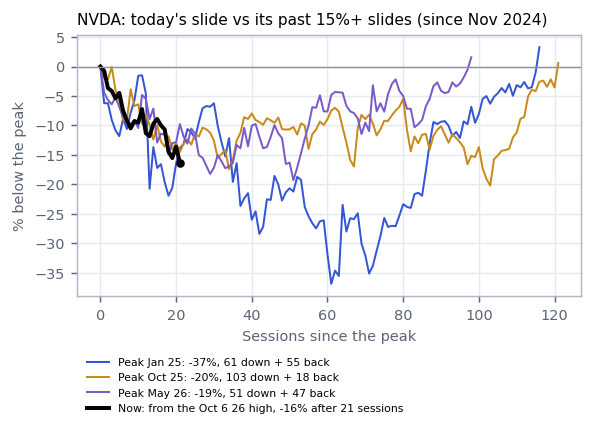
Today vs its past
Its current slide on top of its past 15%+ slides, and what followed charts that looked like today's.
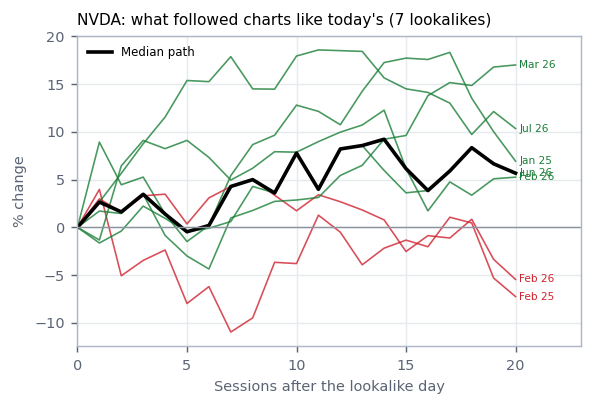
| Next N sessions up | n | 5 | 10 | 20 | Median 20 |
|---|---|---|---|---|---|
| Own lookalikes | 7 | 42.9% | 85.7% | 71.4% | +5.7% |
| 50-stock pool | 176 | 47.7% | 53.4% | 56.8% | +1.2% |
| Baseline (any day) | all | 56.6% | 54.6% | 57.3% | +2.1% |
- NVDA's 5 rally runs since Nov 2024 started from -37% to -19% below the high, RSI 28-38. Today: -16%, RSI 35.
- Reports Nov 17. The lookalike stats ignore earnings; the report can swamp them.
- Part of the chip unwind: see the chip-index overlay. Past major chip slides took about 190-200 sessions to bottom.
- No single shock: a sector slide. The two 2026 slides took 51 and 103 sessions to bottom, then 47 and 18 to recover.
7%+ one-day drops since Nov 2024
| Date | Drop | QQQ | Kind | Cause | Low after | Sessions to low | Back in |
|---|---|---|---|---|---|---|---|
| Jan 27, 2025 | −17.0% | −2.9% | One-time | DeepSeek R1: cheap Chinese AI model raised doubts about AI chip demand. | −33.9% | 48 | 93 |
| Mar 3, 2025 | −8.7% | −2.2% | Earnings | Feb 26 report's gross-margin guide dipped (-8.5% Feb 27), then tariffs confirmed Mar 3. | −24.5% | 24 | 51 |
| Apr 3, 2025 | −7.8% | −5.4% | Market | "Liberation Day" tariffs. | −14.6% | 1 | 5 |
7%+ up days and rally runs
| Date | Gain | QQQ | Setup before | Cause | Next 20 |
|---|---|---|---|---|---|
| Jan 28, 2025 | +8.9% | +1.5% | -21%, RSI 34 | Rebound the day after the DeepSeek selloff. | +1.8% |
| Apr 9, 2025 | +18.7% | +12.0% | -36%, RSI 32 | 90-day tariff pause (market-wide; QQQ +12%). | +2.7% |
| Feb 6, 2026 | +7.9% | +2.1% | -17%, RSI 34 | −1.5% | |
| Aug 27, 2026 | +8.7% | +1.4% | -11%, RSI 46 | Q2 FY27 results and guidance. | −1.2% |
Rally runs (20%+ from a low)
| Low | High | Gain | Sessions | From high at low | RSI at low |
|---|---|---|---|---|---|
| Feb 3, 2025 | Feb 20, 2025 | +20.1% | 12 | −21.9% | 37 |
| Apr 4, 2025 | Apr 9, 2025 | +21.2% | 3 | −36.9% | 28 |
| Apr 21, 2025 | Oct 29, 2025 | +113.7% | 133 | −35.1% | 38 |
| Mar 30, 2026 | May 14, 2026 | +42.7% | 32 | −20.2% | 34 |
| Jul 29, 2026 | Oct 6, 2026 | +26.1% | 48 | −19.3% | 38 |
Calls on NVDA and what followed
Live = saved on the day. Backfill = the same rule re-run on past weeks with only the data known then.
| Date | Kind | Call | From high | RSI | Next 5 | Next 20 | vs SPY 20 | Worst in 20 |
|---|---|---|---|---|---|---|---|---|
| Nov 4, 2026 | live | No clear edge | −16.3% | 34 | – | – | – | – |
| Oct 30, 2026 | backfill | No clear edge | −14.5% | 35 | – | – | – | −2.2% |
| Oct 23, 2026 | backfill | No clear edge | −11.8% | 38 | −3.0% | – | – | −5.1% |
| Oct 16, 2026 | backfill | No clear edge | −10.5% | 38 | −1.5% | – | – | −6.5% |
| Oct 9, 2026 | backfill | Leans drop | −4.2% | 53 | −6.6% | – | – | −12.7% |
| Oct 2, 2026 | backfill | No clear edge | −0.5% | 63 | −2.0% | −12.5% | −10.7% | −12.5% |
| Sep 25, 2026 | backfill | No clear edge | −4.3% | 55 | +3.9% | −6.3% | −4.8% | −6.3% |
| Sep 18, 2026 | backfill | No clear edge | −5.5% | 54 | +1.3% | −3.7% | −3.9% | −3.7% |
| Sep 11, 2026 | backfill | No clear edge | −7.2% | 50 | +1.8% | +5.0% | +2.9% | −3.4% |
| Sep 4, 2026 | backfill | No clear edge | −2.2% | 60 | −8.3% | +3.8% | +3.0% | −8.3% |
| Aug 28, 2026 | backfill | No clear edge | −7.6% | 52 | +5.9% | +5.3% | +5.6% | −2.9% |
| Aug 21, 2026 | backfill | Leans rally | −8.8% | 51 | +1.3% | +6.0% | +4.7% | −2.9% |
| Aug 14, 2026 | backfill | No clear edge | −4.4% | 63 | −4.6% | −6.2% | −4.2% | −7.4% |
| Aug 7, 2026 | backfill | No clear edge | −4.9% | 64 | +0.5% | +2.9% | +3.3% | −6.9% |
| Jul 31, 2026 | backfill | No clear edge | −14.7% | 48 | +11.6% | +8.4% | +5.4% | +2.9% |
| Jul 24, 2026 | backfill | No clear edge | −12.2% | 51 | −2.9% | +3.8% | +0.2% | −8.1% |
| Jul 17, 2026 | backfill | No clear edge | −13.9% | 48 | +2.0% | +11.0% | +6.6% | −6.3% |
| Jul 10, 2026 | backfill | No clear edge | −10.4% | 57 | −3.9% | +6.2% | +3.7% | −9.9% |
| Jul 2, 2026 | backfill | No clear edge | −17.3% | 41 | +8.3% | +3.0% | +2.7% | −2.5% |
| Jun 26, 2026 | backfill | No clear edge | −18.2% | 38 | +1.6% | +2.1% | +0.7% | +1.2% |
| Jun 18, 2026 | backfill | Leans rally | −10.5% | 50 | −8.6% | −3.5% | −2.9% | −8.6% |
| Jun 12, 2026 | backfill | Leans rally | −12.9% | 45 | +1.7% | +3.2% | +1.6% | −6.2% |
| Jun 5, 2026 | backfill | Leans rally | −12.9% | 44 | +0.0% | −4.0% | −5.6% | −6.1% |
| May 29, 2026 | backfill | No clear edge | −10.4% | 49 | −2.7% | −7.6% | −5.8% | −8.7% |
| May 22, 2026 | backfill | No clear edge | −8.7% | 54 | +4.2% | −7.0% | −5.6% | −7.0% |
| May 15, 2026 | backfill | Leans drop | −4.4% | 65 | −4.4% | −5.6% | −7.7% | −10.9% |
| May 8, 2026 | backfill | Leans drop | −0.7% | 66 | +4.7% | −2.9% | −3.2% | −4.6% |
| May 1, 2026 | backfill | No clear edge | −8.4% | 53 | +8.4% | +13.1% | +7.8% | −1.0% |
| Apr 24, 2026 | backfill | No clear edge | +0.0% | 72 | −4.7% | +3.4% | −1.1% | −5.7% |
| Apr 17, 2026 | backfill | No clear edge | −2.6% | 71 | +3.3% | +11.7% | +7.6% | −2.6% |
| Apr 10, 2026 | backfill | No clear edge | −8.9% | 61 | +6.9% | +14.1% | +5.5% | +0.4% |
| Apr 2, 2026 | backfill | Leans drop | −14.3% | 49 | +6.3% | +11.9% | +2.0% | +0.1% |
| Mar 27, 2026 | backfill | Leans drop | −19.1% | 36 | +6.0% | +29.3% | +16.5% | −1.4% |
| Mar 20, 2026 | backfill | No clear edge | −16.6% | 38 | −3.0% | +17.0% | +7.7% | −4.4% |
| Mar 13, 2026 | backfill | No clear edge | −12.9% | 45 | −4.2% | +5.0% | +1.1% | −8.4% |
| Mar 6, 2026 | backfill | No clear edge | −14.1% | 42 | +1.4% | −0.1% | +1.6% | −7.1% |
| Feb 27, 2026 | backfill | No clear edge | −14.4% | 40 | +0.4% | −5.5% | +1.9% | −5.5% |
| Feb 20, 2026 | backfill | No clear edge | −8.3% | 55 | −6.7% | −9.0% | −3.3% | −9.0% |
| Feb 13, 2026 | backfill | No clear edge | −11.7% | 47 | +4.8% | +0.2% | +2.1% | −3.1% |
| Feb 6, 2026 | backfill | No clear edge | −10.4% | 51 | −1.4% | −1.5% | +0.3% | −4.4% |
| Jan 30, 2026 | backfill | Leans rally | −7.7% | 57 | −3.0% | −4.5% | −3.7% | −10.1% |
| Jan 23, 2026 | backfill | No clear edge | −9.4% | 54 | +1.8% | +2.1% | +3.1% | −8.4% |
| Jan 16, 2026 | backfill | Leans drop | −10.0% | 52 | +0.1% | −0.7% | +0.6% | −7.7% |
| Jan 9, 2026 | backfill | No clear edge | −10.7% | 50 | +0.7% | +2.8% | +2.8% | −7.0% |
| Jan 2, 2026 | backfill | No clear edge | −8.8% | 56 | −2.1% | −1.7% | −3.5% | −5.7% |
| Dec 26, 2025 | backfill | No clear edge | −8.0% | 59 | −1.3% | −1.1% | −1.8% | −6.5% |
| Dec 19, 2025 | backfill | No clear edge | −12.6% | 50 | +4.0% | +1.3% | +0.6% | −1.6% |
| Dec 12, 2025 | backfill | No clear edge | −15.5% | 40 | +3.4% | +6.2% | +4.1% | −2.3% |
| Dec 5, 2025 | backfill | Leans rally | −11.9% | 48 | −4.1% | +2.6% | +1.5% | −6.3% |
| Nov 28, 2025 | backfill | No clear edge | −14.5% | 42 | +3.1% | +6.3% | +5.4% | −3.4% |
| Nov 21, 2025 | backfill | No clear edge | −13.6% | 42 | +0.6% | +2.7% | −1.5% | −4.4% |
| Nov 14, 2025 | backfill | Leans drop | −8.1% | 49 | −5.9% | −7.3% | −8.6% | −8.0% |
| Nov 7, 2025 | backfill | No clear edge | −9.1% | 48 | +1.1% | −1.4% | −3.3% | −5.9% |